Filtering data
You can base the visualizations on the entire set of data, or you can base them on certain data values you have filtered to.
When you filter, certain data values in the data table are filtered
out, and only the filtered values, that is the remaining values, are included
in what is being visualized. All visualizations that are based on this data
table will immediately update to reflect only the filtered values. However, you
can anytime change what is filtered, or return to the full set of data.
Note: Not only
visualizations on the open page are affected; every visualization that is based
on this data table will be updated in your analysis.
The filtering is handled from the
Data in analysis flyout or the
Filters panel. If you think of your loaded data as
a table with rows and columns, each column gets a filter of its own in the
panel. If any column value is filtered out, every row that contains that value
will temporarily be taken away.
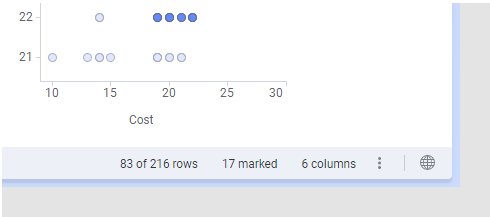
How many rows that remain after filtering, and the total number in the
data table, can be viewed at the bottom of a page. In this example, the entire
data table consists of 216 rows and 83 rows remain after filtering.
As data columns contain different types of data, their associated filters are of different types to make it easy to filter to the values you want to keep. You can however change the filter type that is suggested.
As data columns contain different types of data, their associated filters are of different types to make it easy to filter to the values you want to keep. You can however change the filter type that is suggested.
How to filter data is described in Filtering data using the Data in analysis flyout and Filtering data using the Filters panel.