Tags
The attachment of tags to data rows is a method to distinguish and group rows exactly as you wish. It could be any data table rows that you consider have something in common, and you would find it beneficial to be able to identify them quickly in different visualization contexts. For example, you might want to assign a 'Top 10' tag to the highest ten values of a measure, or tag rows with 'Good', 'OK', or 'Bad'. Rows with the same tag, and also the rows that are untagged, can then easily be identified in a visualization.
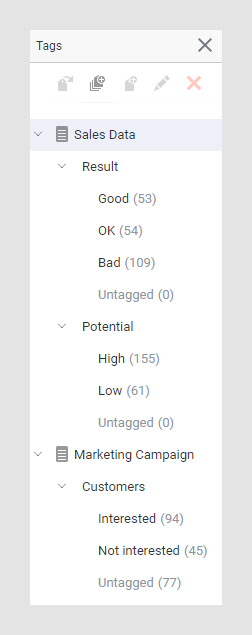
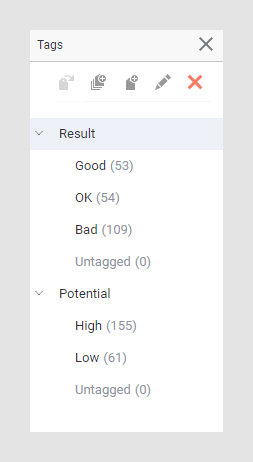
You can view and handle tags in a panel, opened by selecting View > Tags on the menu bar. The image below shows an example of the Tags panel. Once rows have been tagged, you simply double-click a tag in the panel to mark all its rows in the visualizations.
The tags used to group the data rows form a tag collection, and the tag collection becomes a new data column in the data table. Its different tags are the column values. The column is treated in the same way as any other column.
You attach the tags to rows that have been marked. The active visualization defines which marking to get the marked rows from. Each row can only contain a single tag from each tag collection. Tags can only be attached to rows from a single data table, but the same tag collection and tag names can be used for multiple data tables.