TIBCO Cloud™ Spotfire® Web Client User Guide

Adding location capabilities to an analysis

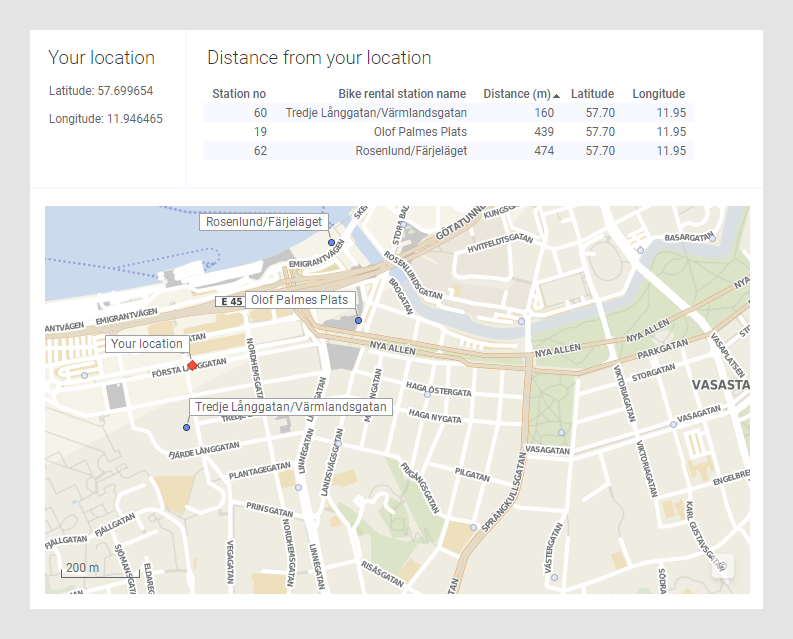
If your data has latitude and longitude columns, you can create an analysis that an iOS mobile device user can access to determine the distance from a location. Just add the reserved document properties and a calculated column for distance calculation, and then share your analysis with mobile users. The document properties activate the location icon in the mobile device. The following example demonstrates how to create such an analysis and test it.

About this task

The following examples demonstrate how to create such an analysis and test it.

Adding the location properties

The first step to use location capabilities is to add the reserved properties to the analysis.

Before you begin

Document properties must be added in the installed client.

Procedure

  1. In the installed client, open a file containing the data with latitude and longitude columns.
    Tip: In the installed client, you can use the Import Settings dialog to make sure the column names and data types are correct. You can always change column names and data types at a later time from the expanded Data in analysis flyout (in all clients).
  2. On the authoring bar, click to open the Visualization types flyout.
  3. Drag the Map chart to the wanted position on the analysis page.
  4. On the menu bar, select File > Document properties, and in the Document Properties dialog, click the Properties tab.
  5. Click New, and in the resulting dialog, provide the reserved name AppGeoLatitude.
  6. Set the Data type to Real, and the Value to 0.0 (the equator).
    For testing purposes, you can set AppGeoLatitude to your latitude, but before saving the final version, set it to 0.0.
  7. Add another document property, providing the reserved name AppGeoLongitude, setting the Data type to Real and setting the Value to 0.0 (the prime meridian).
    For testing purposes, you can set AppGeoLongitude to your longitude, but before saving the final version, set it to 0.0.

Results

Your analysis now has the document properties required to activate the location icon on a mobile device that can open it (available for a consumer user, either on TIBCO Cloud Spotfire or on premises).

Adding distance calculation capabilities for mobile users

When the location properties is in place, you can use them to calculate distances between the current location and one or marked locations in a data table.

Procedure

  1. On the menu bar, select Data > Add calculated column.
  2. In the Expression field, enter the following expression:
    6371000*GreatCircleDistance(${AppGeoLatitude}, ${AppGeoLongitude}, [Latitude], [Longitude])
    Note: This calculation shows distances in meters. To specify miles, use 3959. To specify kilometers, use 6371.
    The example uses Latitude and Longitude to reflect column names. If yours differ, modify the example.
  3. Give the new column a name, such as 'Distance', and click OK to save and close the dialog.

Results

Your analysis now includes a column that you can use to measure distances between the iOS device and any data point in the data table by using the geo-positioning properties.

Adding visualizations for app users to see location and distances

Before you begin

Text areas must be authored in the installed client.

Procedure

  1. In the installed client, open the analysis containing the location data and the reserved document properties.
  2. On the authoring bar, click to open the Visualization types flyout.
  3. Drag the Map chart to the wanted position on the analysis page.
  4. Open the flyout again and drag the Text area to the wanted position on the page.
  5. Right-click the new text area, and then click Properties.
  6. In the dialog, provide a title, such as 'Your location'. Close the dialog to save the change.
  7. Click the Edit icon.
  8. In the Edit Text Area dialog, type "Latitude:" and click Insert Property Control > Label.
  9. In the Property Control dialog, click to select the document property AppGeoLatitude and click OK.
  10. In the Edit Text Area dialog, type "Longitude:" and click Insert Property Control > Label.
  11. In the Property Control dialog, click to select the document property AppGeoLongitude and click OK.
  12. Click Save and then close the edit mode of the text area.
  13. Right-click the map visualization, and from the menu, select Create details visualization > Table.
  14. Right-click the table visualization, and then click Properties.
  15. Provide a name for the visualization, such as 'Distance from your location'. You might also want to adjust the order of the columns in the table so the new 'Distance' column is visible. Close the dialog to save the changes.
  16. Test the visualization by selecting a data point or a range of data points on the map.
    The details visualization shows the selected data rows, with the calculated column reflecting the distance from the latitude and longitude shown in 'Your location'.
  17. Save the analysis and share with your mobile users.

Results

This example shows bike rental stations in a Swedish city. Each rental station has a location specified by latitude and longitude. You can see the distance (measured in meters) from your current location to the three rental stations that are marked in the map chart.