Configuring an on-demand data table
When working in the installed client, data from a data connection or from an information link can be added as an on-demand data table. By editing the on-demand settings in the data canvas, you can also configure a data table from an external data connection to use on-demand.
About this task
Before you begin
Procedure
-
On the
authoring bar, click
Files and data
 .
.
An on-demand details visualization controlled by marking
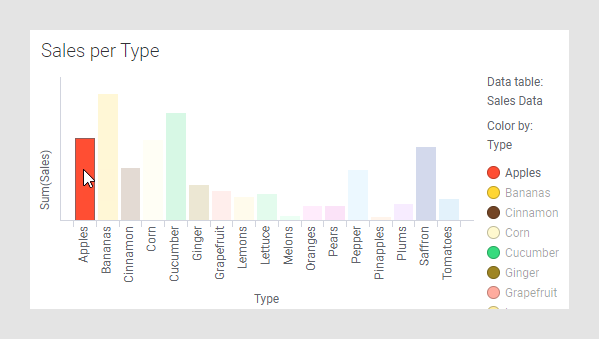
This is an example where you select to load data on demand, and you specify a marking that should control what data to be loaded.
About this task
When you mark items in a visualization that uses the specified marking, the data for the on-demand data table is updated. The update can either be done automatically each time you change the marking, or manually by clicking on the refresh button shown when the marking is changed.
This way, you can create a main visualization in which to specify the item of interest, and an on-demand visualization where more information about the marked item is loaded from the database only when requested. This is similar to the use of a details visualization based on external data.
When one identifier column in the first data table is matched by a similar identifier column in the on-demand data table, the on-demand data table can be added and configured using the following steps:
Procedure
-
On the
authoring bar, click
Files and data
.
Results
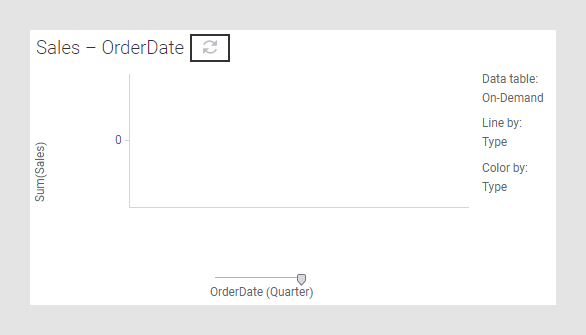
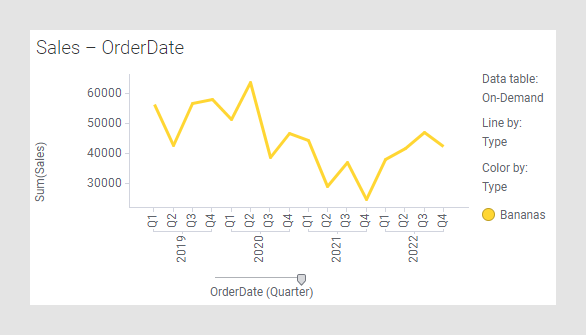
Another visualization is added, based on the on-demand data table. When clicking an item in the main visualization, the refresh button is shown on the title bar of the visualization based on the on-demand data. (If nothing was marked from the beginning, the on-demand visualization will be empty until the first refresh.) Click Refresh data table.
The visualization is updated to show details about the marked item:
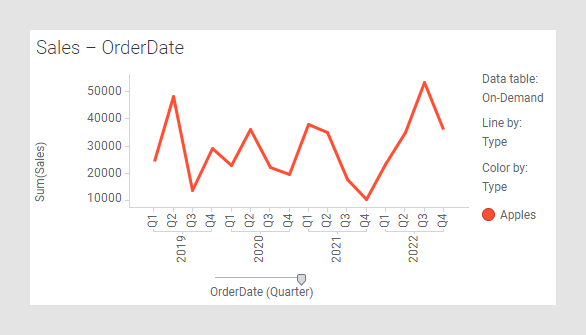
Clicking a different item in the main visualization once again shows the refresh button in the on-demand visualization.
Click refresh to update the on-demand visualization to use the new marking:
An on-demand data table controlled by a property
The data that is to be loaded on demand can be controlled in a number of ways. The example below uses a property control in a text area to select which data to show in a bar chart based on an on-demand data table.
About this task
In this example, we first assume that we have a data table containing a string column called "Type" which lists a number of different product types loaded in the analysis. We also assume that there is a data connection with some additional data available, which also contains a "Type" column. See Adding Data Connections to an Analysis or How to Work with Data Connections and their Data Sources in the Library in the Spotfire Analyst User Guide for more information about connections.
Procedure
-
Click
OK in all dialogs and the flyout.
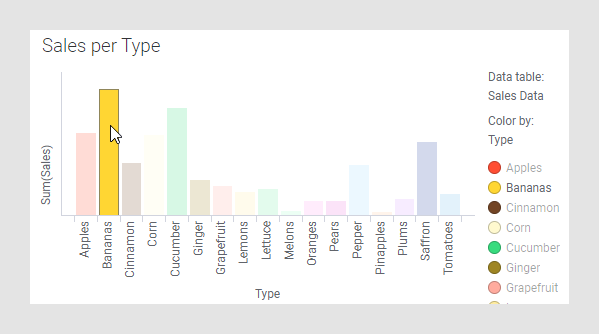
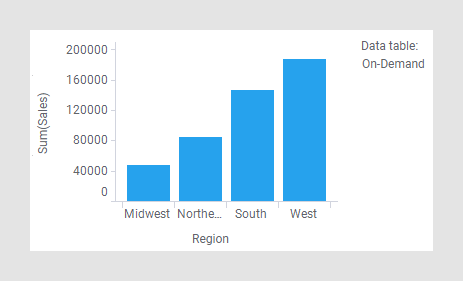
The on-demand data table is loaded using the limiting default value and can be used in visualizations. In the example below, the visualization used is a bar chart showing the sum of sales for Apples in four different regions.
By adding a property control to a text area, other people can easily change the value of the document property and, hence, update the on-demand visualization. See Adding a property control to a text area for more information.
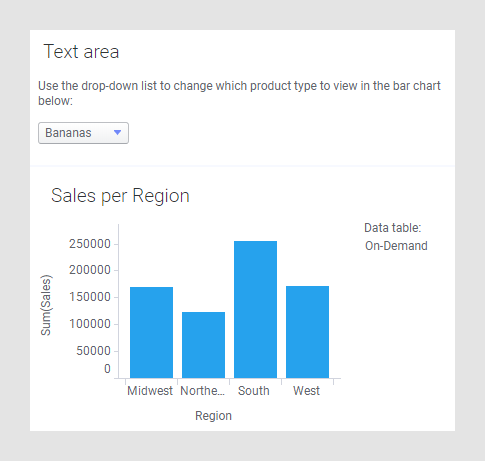
If Load automatically was selected in the on-demand settings, the visualization will be updated each time the property is changed via the control. If Load automatically was cleared, a refresh button will be displayed on the title bar of the visualization each time the input is changed.