Data tables in Spotfire
The data table is a central concept in Spotfire. All visualizations you create are based on data from one or more data tables in the analysis. You automatically get a data table when you add the first data to an analysis, but the data table can often be refined by adding more data from other sources (as rows or columns), by adding calculated columns or hierarchies, applying transformations, and so on. You can work with your data table in the data canvas. An analysis can contain one or more data tables and all data tables are saved when the analysis is saved.
The data in a data table can be either fetched from a data source, or created within the application. Data loaded from a data source can be handled either in-memory or in-database depending on how it is added to the analysis. See Load methods for more information. In-memory data tables have one or more columns and zero or more rows, whereas in-database data tables technically do not contain any data but simply fetch the requested data directly from the source. See Types of data in Spotfire for more information.
When there are multiple data tables in an analysis, they can either be completely separate from each other, or, they can be more or less tied to each other. See Related data tables, joins and column matches for more information.
-
Relations: When data tables are related, any marking or
filtering in one data table can be propagated to the other related data tables,
if desired.
Note: In the installed client, you can specify whether or not filtering in a data table should affect what is shown in visualizations used by other, related data tables. The default setting is to ignore filtering in related data tables. See Filtering in related data tables for more information.
- Column matches: Data tables can also have column matches between them, if columns are of the same data type. They are often created automatically, if the data is similar. A column match is used to aggregate data correctly when the data from different data tables is combined in a single visualization. Column matches are much looser in nature than the relation mentioned above, because they do not join the data tables together. Marking and filtering is still individual for each data table, even if they have columns matching between them. To learn more, see Column matches. To see which column matches exist in the visualization, open the Column Matches tab in Data Table Properties in the installed client. You can also see which column matches are used in a specific visualization by opening the Visualization properties dialog and going to the Data section for the visualization of interest.
On-demand data tables
On-demand data tables are data tables to which only rows related to a defined input are loaded. The input could be something like the marked rows in another, related, data table, the filtered rows of another data table or a property value selected in a text area. Changing the input means changing the "demand", that is, that more, fewer or other rows are loaded into the data table. On-demand data tables can be used by details visualizations, and only data from information links or data connections can be loaded on demand.
In-database data tables
Because data from in-database data tables is retrieved only when needed, the use of an in-database data table as a details visualization can also be seen as a type of on-demand visualization. For obvious reasons, this is not applicable for streaming data, because it is in fact updated continuously and not only when needed.
Information about the active data table in the status bar
The status bar is located at the bottom or the top of the window and
shows information about the main data table used by the active visualization
(the visualization that was last clicked upon). If the information is not
visible, click
 .
.
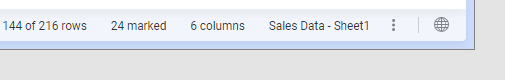
The information displayed is:
- the current number of filtered rows and the total number of rows in the main data table (but if the data table is loaded on demand, then the number of currently loaded rows is shown).
- the number of marked rows,
- the number of available columns,
- the name of the main data table in the active visualization.
Note that in-database data tables (external data) do not have access to the detailed information about rows and columns because the data shown in a visualization is aggregated by the external data source and not within Spotfire.