The actual values of the data rows that are included in
visualization items can be viewed in the
Details-on-Demand
panel.
About this task
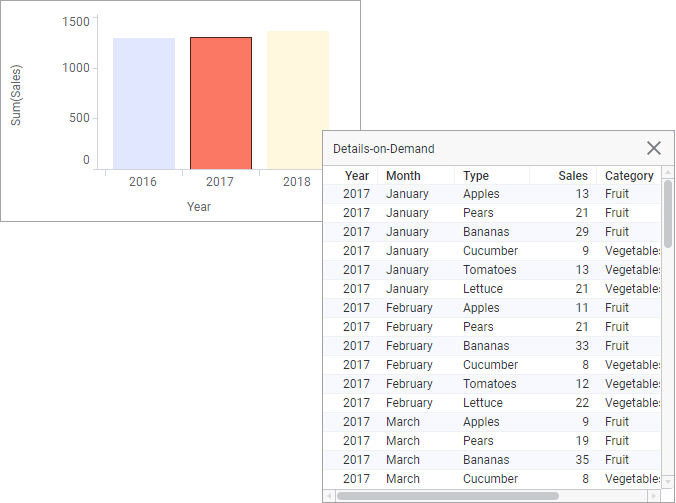
To select which
items the row values should be displayed for, you mark them. If you mark, for
example, a bar in a bar chart, all the data rows included in that bar are
listed in
Details-on-Demand panel as shown below.
Before you begin
A visualization is
created.
Procedure
-
If the
Details-on-demand panel is not visible, select
on the menu bar.
The
Details-on-Demand panel is displayed on the
right-hand side of the page.
-
In the visualization,
mark the
items, which you want to display row details for.
The data rows included in the marked items are listed in
the panel.