Information and warnings
If something is off, you might see information or warning icons in different places in the analysis. You can often hover with the mouse pointer or click the icon to see more information.
Information icons in visualizations
If there are items in a visualization that cannot be shown or might be
misinterpreted because of the current settings, an icon is shown on the title
bar of that visualization. If something cannot be shown in the visualization, a
notification icon
![]() , is displayed. If there is
a risk that something might be misinterpreted due to lack of data to calculate
a curve or similar, a warning icon
, is displayed. If there is
a risk that something might be misinterpreted due to lack of data to calculate
a curve or similar, a warning icon
![]() , is shown. On mouseover, a
tooltip is shown, and if you click the icon a longer description is displayed.
, is shown. On mouseover, a
tooltip is shown, and if you click the icon a longer description is displayed.
Getting system information
You can see information about the server and deployment area you are
connected to by hovering with the mouse pointer on the globe icon to the right
on the status bar
 . There, you can also see
the user you are logged in as, and which client or server version you use.
. There, you can also see
the user you are logged in as, and which client or server version you use.
Click the globe icon to see progress information for calculations and processes that run in the background.
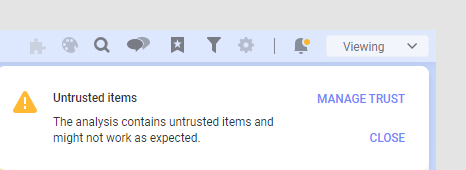
Viewing details about notifications and warnings
Click the notifications icon to display all notifications about current issues in a panel.
Click on a specific notification to view more details about that particular issue in a separate dialog. From this dialog, you can copy alerts to the clipboard and use the information when communicating with others during troubleshooting of an analysis.
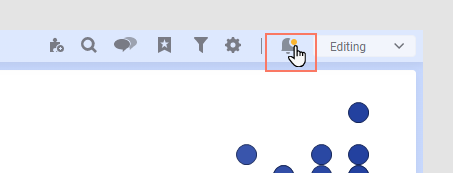
Switching off pop-up notifications
- Click the
Notifications icon on the toolbar
 .
.
- In the Notification panel, clear the Show pop-up notifications check box.
Clearing the notifications panel
- Click the
Notifications icon on the toolbar
.
- In the Notifications panel click Dismiss all.