Selecting columns on an axis
When creating a visualization, you select which data columns to show on various axes such as on the X-axis, the Y-axis and the color axis.
About this task
 , which displays the
current column. To switch to another column, or add more columns to an axis,
either use the
Data in analysis flyout, or use the column
selector itself.
, which displays the
current column. To switch to another column, or add more columns to an axis,
either use the
Data in analysis flyout, or use the column
selector itself.
Selecting columns using the Data in analysis flyout
Procedure
-
If the
Data in analysis flyout is not visible,
click
Data in analysis
 on the authoring bar.
-
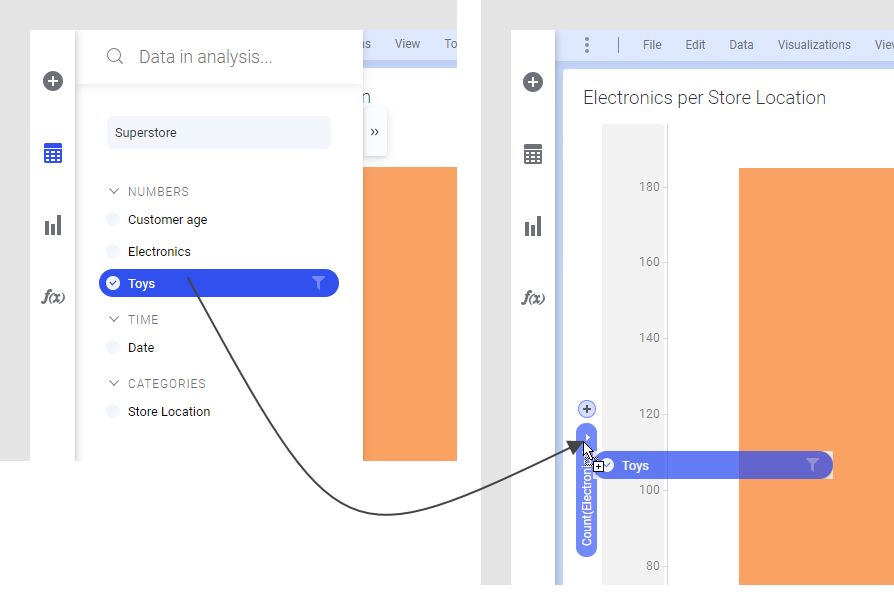
In the flyout, find the column you want to visualize and drag it
to the column selector in question.
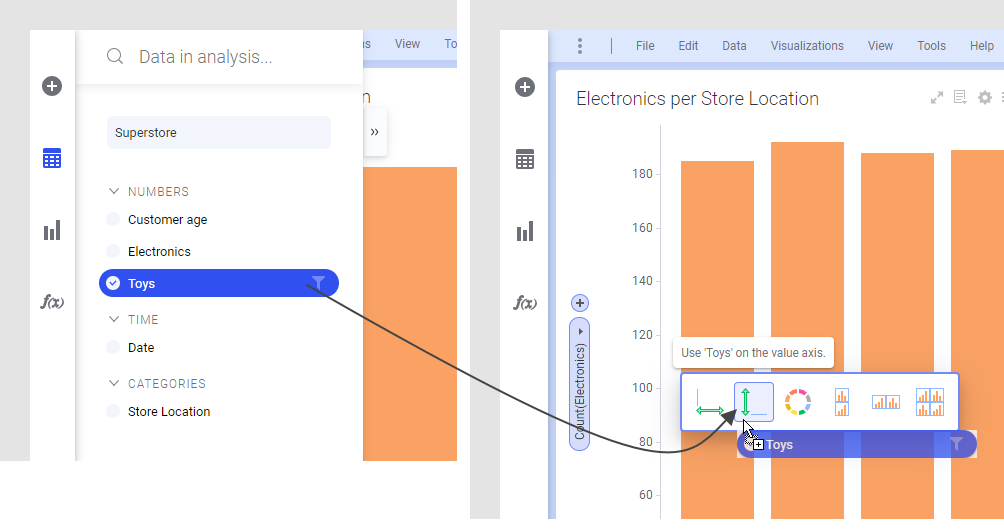
- Alternatively,
drag the column to the visualization, where different drop targets appear
representing various axes. Drop the column on the wanted axis.
- Alternatively,
drag the column to the visualization, where different drop targets appear
representing various axes. Drop the column on the wanted axis.
-
To display more than one column on the axis, select another
column in the flyout, and drag it to the plus sign next to the column selector.
Repeat to add more columns.
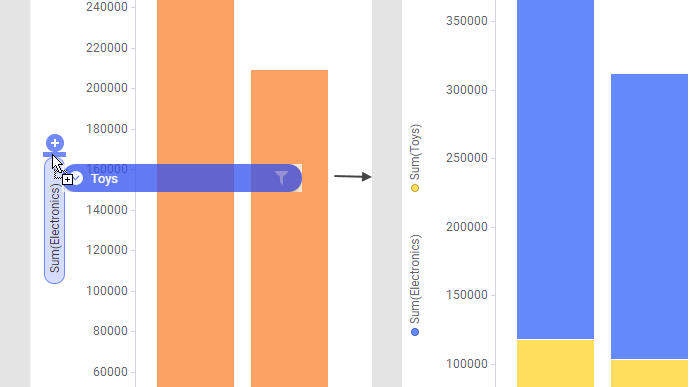
Note: When the number of columns added to an axis exceeds three, the name of each column will no longer be shown, only the number of columns.
Selecting columns using the column selector
Procedure
-
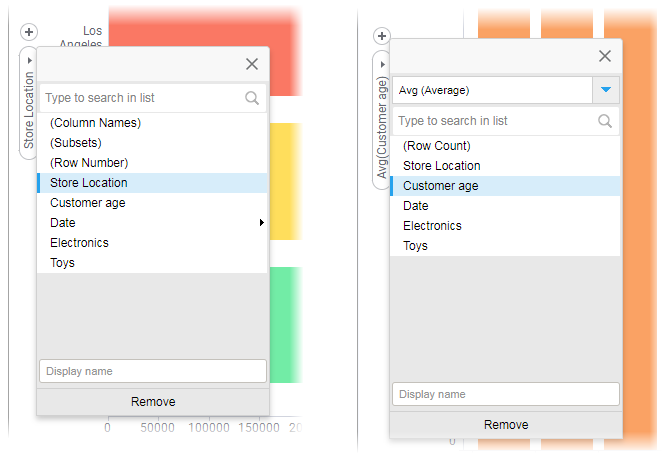
In the column selector, click the arrow next to the column name.
A popover listing all columns in the data table opens. Depending on the type of axis and type of column data, the popover might look slightly different, as shown below. Axis selectors in the installed client can also be expanded to show more functionality.