Setting conditions on axes
When creating a visualization, you select which columns to present on the various axes, and how to aggregate the data. What is more, you can determine in more detail what to display by specifying conditional expressions on the axes. That way, what is shown in the visualizations depends on the conditions.
About this task
 If(Arg1,
	 Arg2,Arg3)
. You interpret it as "if argument 1 is true, return
argument 2 as the result, but if argument 1 is false, return argument 3".
For example, the expression
If([Amount]<10,"yes","no") says that "if the value in the Amount
column is lower than 10, the result of the expression is yes, but if the value
is 10 or higher, the result is no".
Below are some examples of how you can apply conditional expressions in different visualizations.
Conditional expression applied on the value axis in a bar chart
About this task
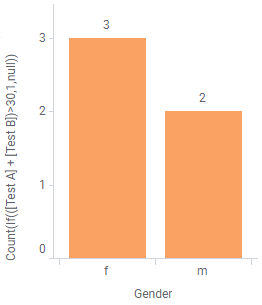
The example data contains test results for a number of people. To
pass the overall test, the summarized result from Test A and Test B must exceed
30. Assume you want to show how many men and how many women succeeded, and
leave out those who did not pass.
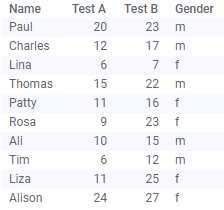
As a start, the bar chart is created with one bar per gender.
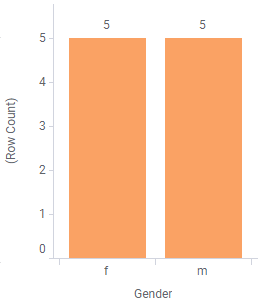
As a start, the bar chart is created with one bar per gender.
Procedure
-
Click
OK.
The value axis expression now shows how many passed the test.
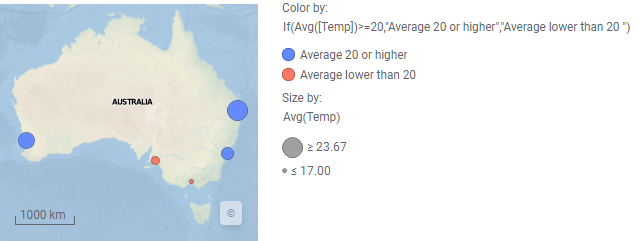
Conditional expression applied on the color axis in a map chart
About this task
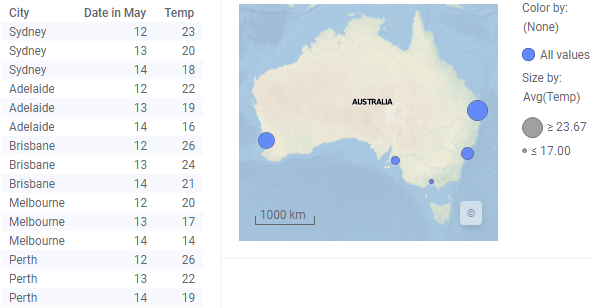
You may want to distinguish cities with an average temperature higher than 20° C by coloring their markers differently from the other markers. This can be done by applying a conditional expression on the color axis.
Procedure
-
Click
OK.
The result of the color axis expression is a split into two categories, one category with cities fulfilling the condition, and one category that does not. The categories are colored differently.