Using tiled markers
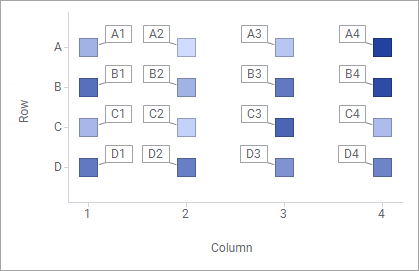
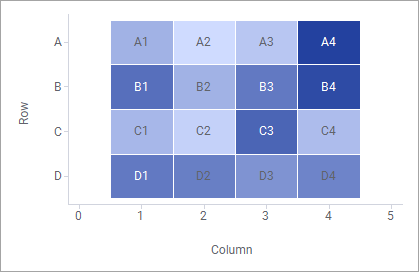
A special use of marker shapes in a scatter plot is the tiled markers. Tiled markers are shaped as rectangles, displayed without gaps in a grid, and any added labels are always centered.
About this task
Before you begin
Procedure
Example
An example of a scatter plot with tiled markers (also known as wafer map) is useful when visualizing and analyzing semi-conductor and plate array tests, because it resembles the actual layout.
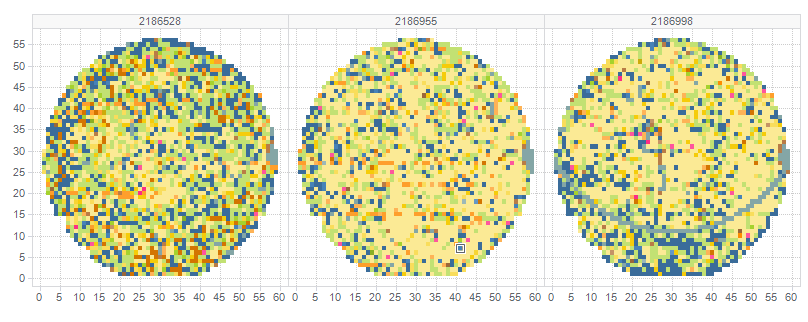
For more examples, see Creating a density plot.