Year to Date Total
The Year to Date Total expression shortcut calculates the cumulative sum within each year. This shortcut is only applicable when you are having a time hierarchy including year on the X-axis.
Example
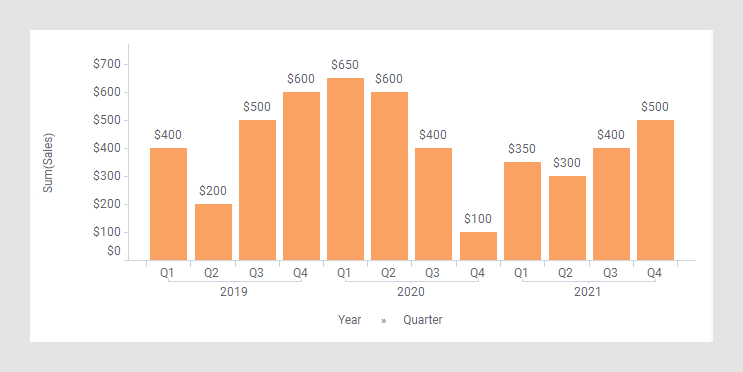
As starting point, the bar chart below is used. It shows the quarterly sums of sales for three years.
In the next bar chart, the shortcut expression Year to Date Total has been applied on the Value axis. (The arrow points to a bar used to explain what is calculated in the expression further down.)
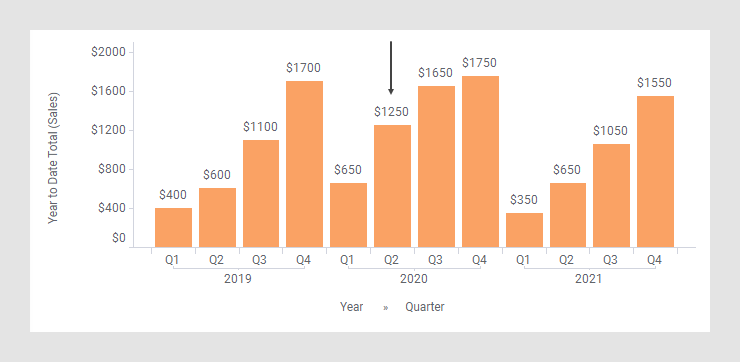
The following expression is used on the Value axis:
Sum([Sales]) THEN Sum([Value]) OVER
		(Intersect(AllPrevious([Axis.X]), NavigatePeriod([Axis.X],"Year",0.0)))
The first part of the expression specifies that the column [Sales] should be aggregated as a sum. The result of this part goes into the [Value] column to be used in the expression following THEN.
In this latter part, the nodes within an intersection of the results from two node navigation methods are summed; the AllPrevious() method and the NavigatePeriod() method. No matter which quarter you look at, the intersection will result in a period that begins with Q1 and ends with that quarter.
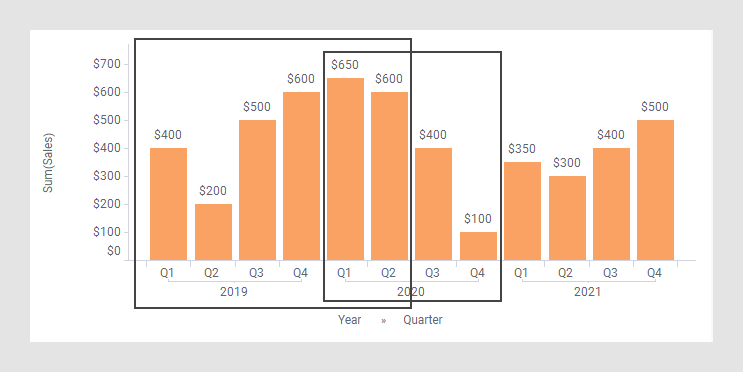
For example, calculation of the Year to Date Total for Q2, 2020 (see the arrow in the previous image):
$1250=$650+$600
(see the left rectangle that represents
AllPrevious([Axis.X]) and the right rectangle that
represents
NavigatePeriod([Axis.X],"Year",0.0)).
See also Intersect().
The column selector in expanded mode
In the installed client, the extended column selector offers controls that make it easy to change various parameters in the expression shortcut:
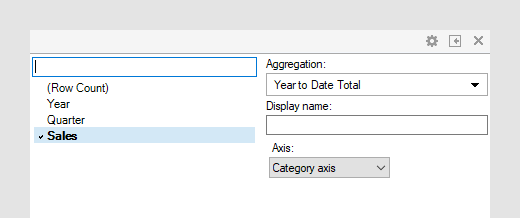
| Display name | Optionally, specify a different display name instead of the default "Year to Date Total ([Column Name])". |
| Axis | Specify the axis over which to calculate
the nodes.
Only categorical axes that perform some kind of grouping can show up in the drop-down list. This means that if you only have a grouping on the X-axis, then this is the only axis available, whereas if you also have colored by a categorical column then the Color axis will be available as well, and so on. |