Binning
Binning is a way to group a number of more or less continuous values into a smaller number of "bins". For example, if you have data about a group of people, you might want to arrange their ages into a smaller number of age intervals.
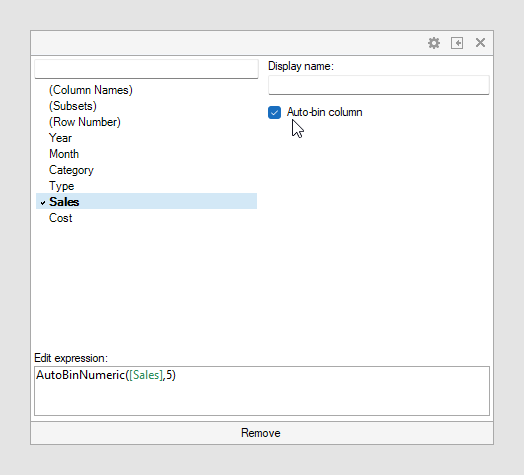
Numeric columns can be temporarily grouped by clicking a column selector and selecting Auto-bin column in the settings.
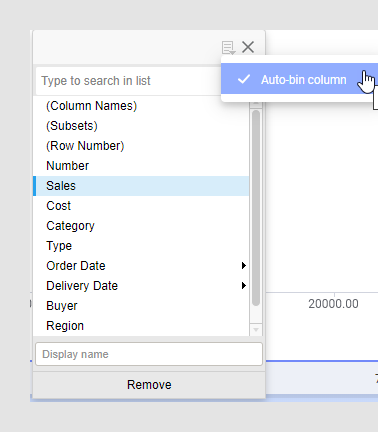
In the web client:
There is also an option to group categorical values into bins. This is useful when you have more categorical values in a column than you find necessary. Your visualization can for example show sales of apples, pears, oranges and limes, but you are interested in citrus fruit sales compared to apples and pears sales. Then oranges and limes can be grouped into a bin.
There are several different binning methods available. See Add binned column for more information.
Example of binning continuous data
The data table contains information about a number of persons.
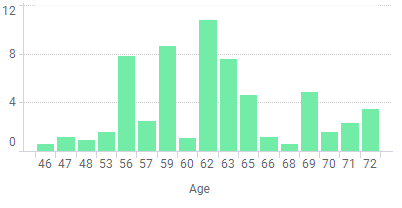
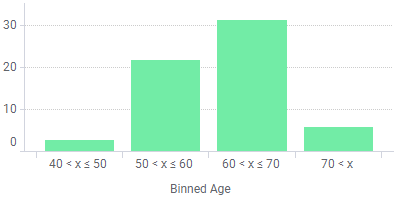
By binning the age of the people into a new column, data can be visualized for the different age groups instead of for each individual.
Example of binning categorical data
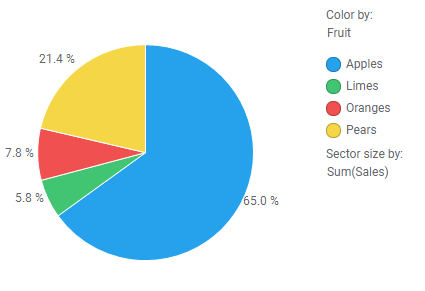
The pie chart shows sales per apples, limes, oranges and pears.
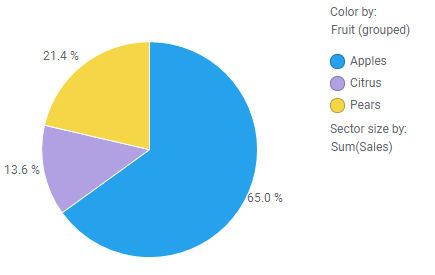
Below, oranges and limes have been grouped into a bin called "Citrus".
Add binned column and calculated columns
The binning tool available under will create a new column in your data table, specifying the bin each row belongs to. The same results are obtained by using the Binning functions in the tool. Calculated bins are always static and each row belongs to the same bin at all times, independent on any filtering.Binning using custom expressions
When binning functions (such as
BinByEvenIntervals or
BinByEvenDistribution) are applied as custom
expressions, the results from a binning operation is depending on whether the
axis expression is evaluated on all data or on the currently filtered data
only. If all data is used, you will get a result similar to the calculated bin
columns above, with a specific set of bins. However, if current filtering is
taken into account, then the bins are recalculated with the filtering and the
bin limits will be dynamically updated.
The default setting is that all data is taken into account when the axes are evaluated, but you can change this setting in the visualization properties for the axis of interest. See Axis settings for more information.