TIBCO Cloud™ Spotfire® User Guide

Creating a density plot

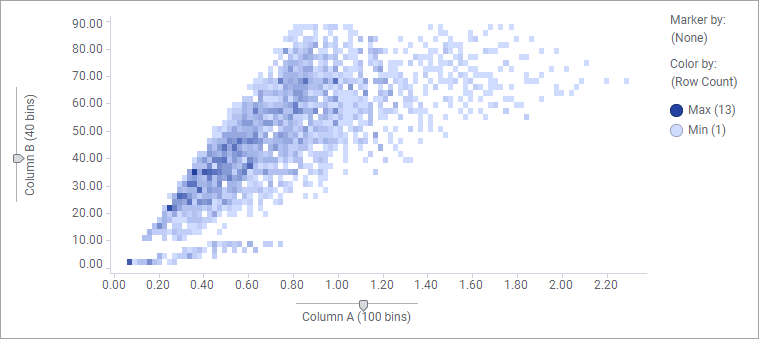
The density plot shows how numerical data, binned into intervals, is distributed across the X-axis and Y-axis. To visualize the density, that is, visualize to which extent the markers overlap each other totally, the Color by setting is used.

About this task


Density plot

The markers that represent the binned values are shaped as tiles in a grid.

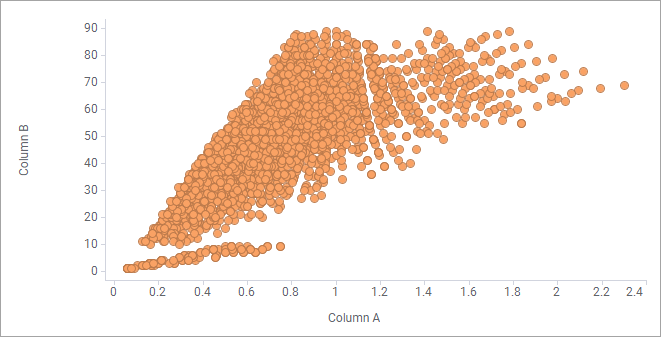
A density plot is created from a scatter plot visualization, but a pre-configured density plot can be shown as one of the visualizations that is recommended to you, when you select two numerical data columns in the Data in analysis flyout. Then you can add it by simply dragging it to the visualization canvas. If you want to create the density plot manually, follow the procedure below.

Procedure

  1. On the authoring bar, click Visualization types to open the flyout.
  2. Drag the Scatter plot visualization type to the desired position on the analysis page.
    A suggestion of a scatter plot is presented.
  3. Select the numerical column on the X-axis.
  4. Select the numerical column on the Y-axis.
  5. Auto-bin the X-axis and the Y-axis.
  6. Make sure Marker by is set to (None).
  7. Set Color by to (Row count).
  8. In the visualization properties for the scatter plot, locate the Shape section.
    Note: If you are using the visualization properties panel, you should add Shape on the Configuration tab and not use the shape control under Appearance.
  9. Select Tiled markers.
  10. In the visualization, drag the binning sliders on the axes to adjust the number of bins.

Example

In the scatter plot below, it seems that many markers overlap each other totally.

If you follow the procedure above, the plot that is created indicates the density by letting colors reflect how many data rows the tiled markers represent.


Density plot
Note: If you use tiled markers, and the axes' scales have a large number of values, then the markers might become too small to be seen. The reason for this is that the grid layout makes it necessary for each value on the scales to have a unique position, even if no marker is located at each of these allocated positions. Therefore, with a large number of values on the scale, the markers must become very small to fit in the grid.