Cross table
A cross table is a two-way table consisting of columns and rows. It is also known as a pivot table or a multi-dimensional table.
It is a grid of cells defined by a Row axis (a/k/a Vertical axis) and a Column axis (a/k/a Horizontal axis). On these axes, data columns are specified to organize the data. The actual contents of the table cells are aggregated values, for example, sums or averages of the data, defined by the intersection of the two axes. What data you want to aggregate is selected in another axis, the Cell values axis.
Its greatest strength is its ability to structure, summarize and display large amounts of data. You can also use the cross table to determine whether there is a relation between the row variable and the column variable.
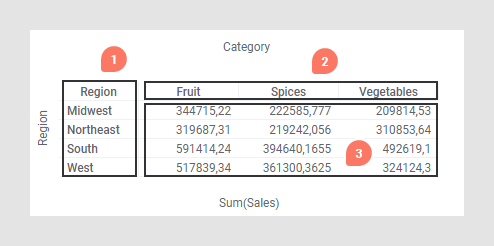
- Row axis (or Vertical axis) – defines the column (hierarchy) titles in the cross table.
- Column axis (or Horizontal axis) – defines the row (hierarchy) titles in the cross table.
- Cell values – defines the actual values.
You can change the appearance of the cross table. For example, headers can be shown horizontally or vertically, and the horizontal as well as the vertical alignment of the header texts can be specified.
Example
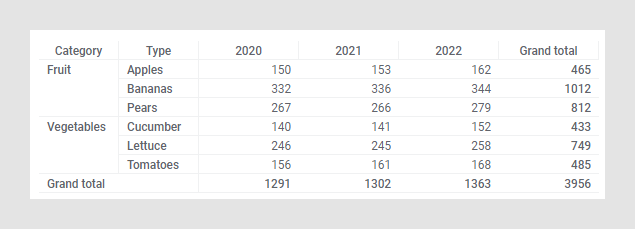
Below is a cross table showing the sum of sales for different types of fruits and vegetables.
You can change the height and width of the columns by clicking and dragging, same way as for regular tables.
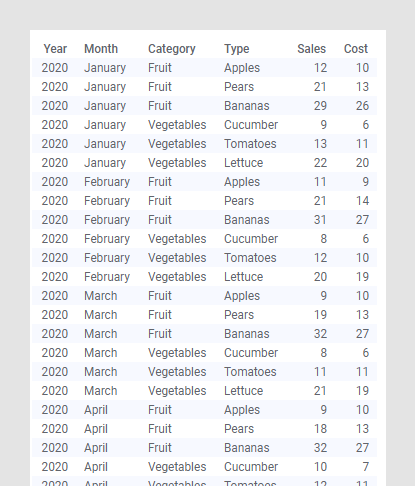
The same data shown in a regular table takes up far more space and it is much more difficult to get an overview:
In some cases, you can change the rendering method of the axis labels from text to images in the Label rendering section of the visualization properties. See the label rendering section under Renderer settings for more information.
You can show grand totals for columns and rows (the example above shows grand totals for columns as well as rows). See Displaying totals to learn more about totals.
In the installed client, you can configure the cross table so that its cells will be colored based on the values in a column, see Coloring in tables, cross tables, and heat maps to learn more.
All visualizations can be configured to show data limited by one or more markings in other visualizations only (details visualizations). Cross tables can also be limited by one or more filterings. Another alternative is to configure a cross table without any filtering at all. See Adding data limitations for a visualization for more information.
You can show data from multiple data tables in the same visualization if a proper data table matching is available. For more information, see Multiple data tables in one visualization and Column matches.