Marking items using the legend
You can mark items of a certain category using the legend in a visualization.
About this task
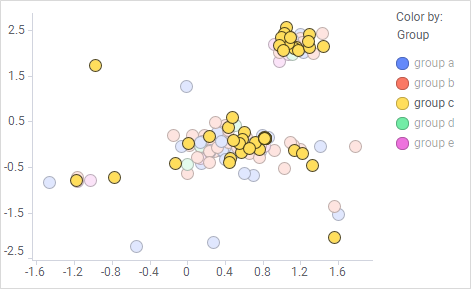
For example, in the scatter plot below, the
Color axis is used to mark all items in the
"group c" category, that is, all yellow items. The other categories, "group
a-b" and "group d-e", are grayed out in the legend to indicate that only the
"group c" is marked.
Note: The legend cannot
be used to mark items on axes with numerical data (unless a coloring rule has
been applied). Only categorical data on the following axes can be marked: the
color, shape and series axes.