Subsets
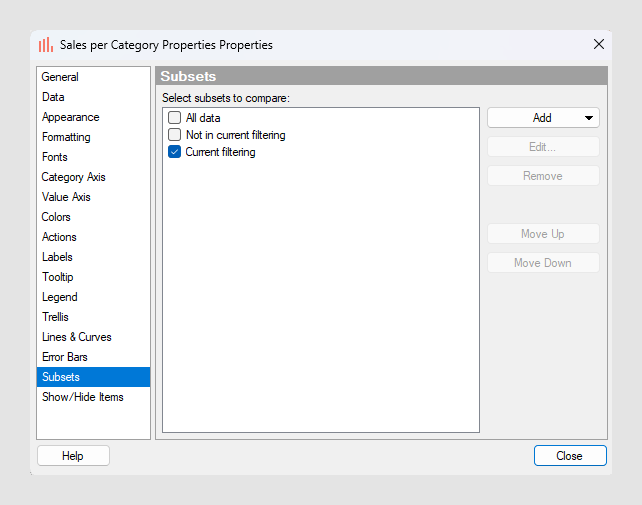
With subsets you can compare collections of your data within the same visualization. For example, you can compare all data to the current filtering, or the filtered data to the data that has been filtered out. Subsets are defined in the Subsets section of the visualization properties, and can be added to all visualization types except table visualizations. There are three subsets available by default; All data, Current filtering, and Not in current filtering.
The All data subset will show all the data in the underlying data table. It can be a useful reference when you filter in the visualization, because the content of the All data subset will not change when you filter out data. The Current filtering subset will show the data that has not been filtered out using filters. This subset is automatically active from the start; showing the current filtering is the default behavior in visualizations. The Not in current filtering subset will show the data that has been filtered out. You can also add subsets based on markings, filtering schemes and custom expressions.
For example, if the visualization is set up as a details visualization (that is, data is limited by markings), then the All data subset should be interpreted as "all data that has been marked in the main visualizations", and the Current filtering subset should be interpreted as "the additional filtering made on the data that is marked in the main visualizations", and so on.
The All data subset
The example below shows a bar chart where the All data subset is used in combination with the Current filtering subset.
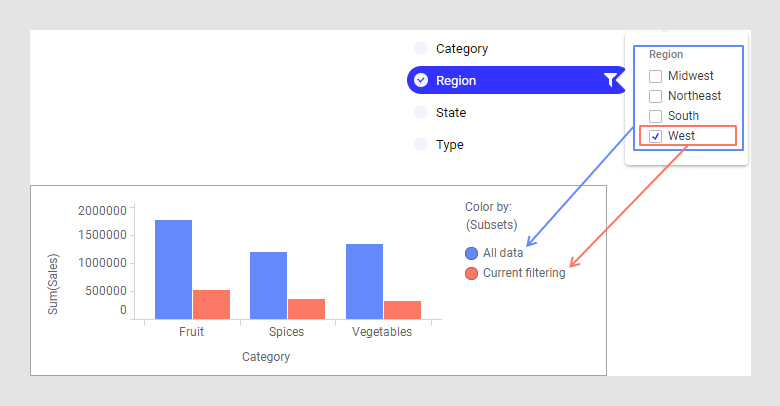
The red bars represent the current filtering, and currently shows sum of sales for region West. When you filter the data in different ways, these bars will be updated as usual to reflect the filtering you do, while the blue bars representing all data will stay unchanged. This makes it possible to compare the filtered data to all the data at all times.
The Not in current filtering subset
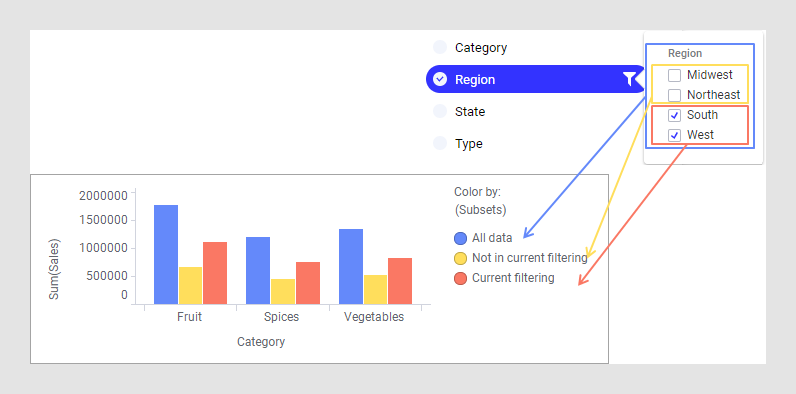
The example below shows a bar chart where the Not in current filtering subset is used in combination with Current filtering.
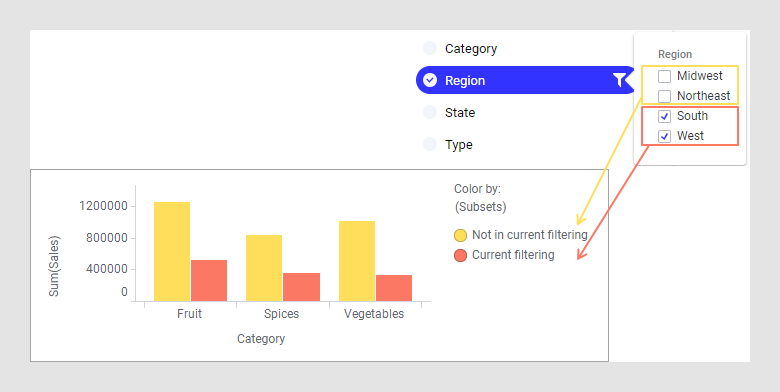
The red bars represent the current filtering; in this case the South and West regions, which are selected in the check box filter. The yellow bars represent the filtered out data; the Midwest and Northeast regions, which are deselected in the check box filter.
Combining subsets
You can also combine all three subsets in a visualization. The bar chart below uses the All data subset, the Current filtering subset, and the Not in current filtering subset.
Selecting (Subsets) on a grouping axis
When you use subsets, the visualization must be grouped by the subsets in some way. Otherwise, the subsets can not be compared. Therefore, the menu option (Subsets) is available on axes that can be used to group the visualization.
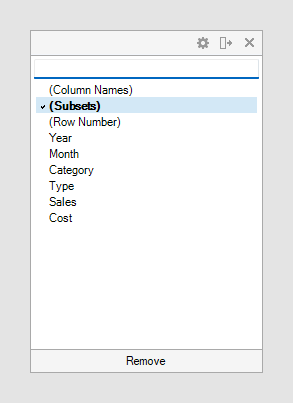
When you add a new subset to a visualization, (Subsets) will automatically be added to a grouping axis. In the examples above, it was added to the color axis, but it could also have been used on other axes, such as trellis by or on the category axis as in the examples below.
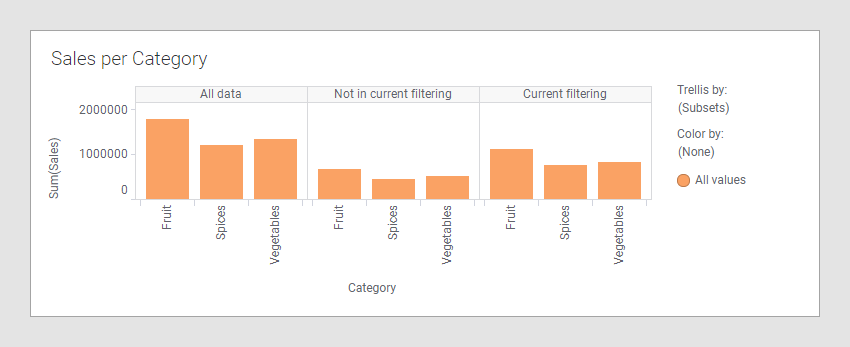
Trellis by (Subsets)
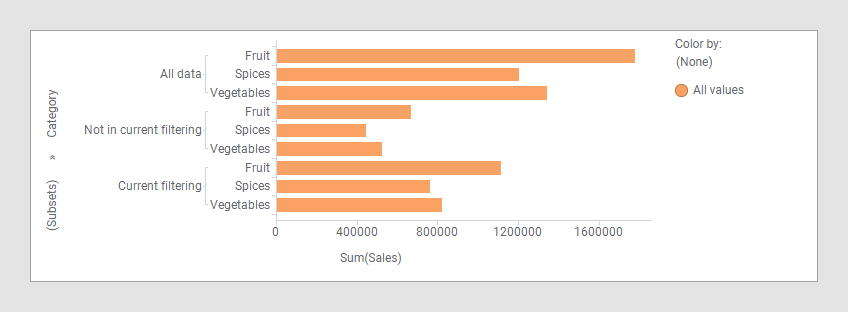
(Subsets) on category axis
When the (Subsets) option is used on an axis, the underlying
expression will be <[Axis.Subsets.Names]>. If the
Subsets expression is to be used together with another categorical column or
hierarchy, each of them must be separated with
NEST or CROSS. For example,
<[Axis.Subsets.Names] NEST [Category]>.
Empty subsets
Subsets can sometimes be empty depending on the current configuration of the visualization. For example, if you are using a marking subset, but no data has been marked, or a filtering scheme subset, but no data has been filtered using that filtering scheme. You can decide how empty subsets should be handled in a visualization.
In the bar charts below, the Not in current filtering subset is used, but no data has been filtered out. This means that the Not in current filtering subset is empty. Depending on the axis category settings, you can choose whether to show or hide the category for empty subsets: The bar chart on the left-hand side shows the empty subset, the bar chart on the right-hand side, hides the empty subset.
This is defined using the category settings on the axis. To learn about how to show or hide empty subsets, see Showing or hiding empty subsets.
The complement of a subset
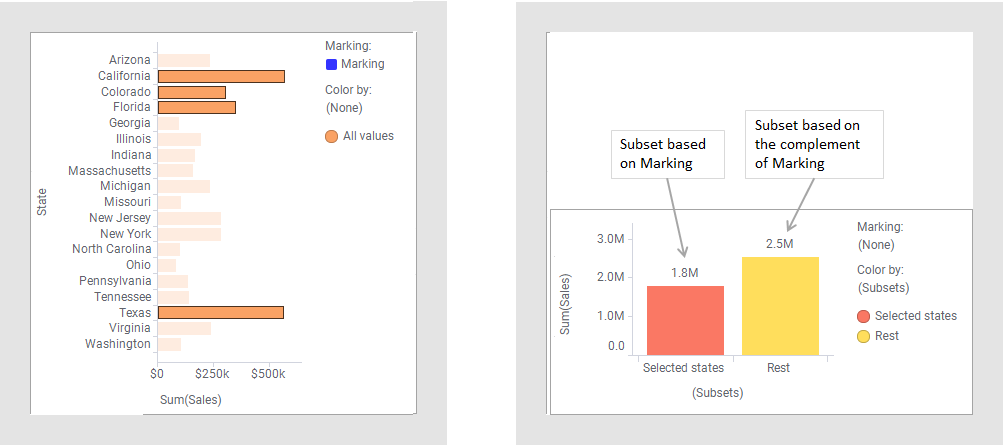
When adding subsets based on a marking or a filtering scheme you can choose to use the complement of the marking or filtering scheme. This means that the subset will show what is not in the selected marking or filtering scheme, rather than what is in them. For example it might be useful to compare what is marked in a visualization to what is not marked in the same visualization.
As an example, the bar chart on the left-hand side below uses a marking named 'Marking', and the bar chart on the right-hand side is made up of two subsets based on that marking. The subset named 'Selected states' shows the aggregated value of the bars that are marked in the bar chart to the left. The subset named 'Rest' shows the aggregated value of all the bars that are not marked in the bar chart to the left; that is, the complement of the marking.