Summary table
The summary table is a visualization that summarizes statistical information about data in table form. The information is based on one data table in the analysis. When configuring the summary table you can choose which measures to show (such as mean, median, and so on), as well as the columns on which to base these measures.

Change the width of an individual measure column by clicking the line between two headers and dragging the red line to a suitable width.
Select whether to show or hide cell borders under Appearance in the visualization properties.
As you change the set of filtered rows, the default configuration for the summary table is to automatically update the values shown to reflect the current filtering.
All visualizations can be configured to show data limited by one or more markings in other visualizations only (details visualizations). Summary tables can also be limited by one or more filterings. Another alternative is to configure a summary table without any filtering at all. See Adding data limitations for a visualization for more information.
You can rearrange the measures in the summary table by dragging them to
the desired position, and sort them by clicking the header. The upward arrow
 shows that the measures
are sorted in an ascending order, while the downward arrow
 shows descending order.
Click the header once more to return the table to its default order. If
categorization is applied, the values for the different categories are sorted
within each measure column.
Adding or removing data columns and adding categorization
To get the statistics for more data columns in the summary table, you
can go to the
Data in analysis flyout and drag one or more
columns to the summary table. Drop them on
 to show statistical
measures for just those columns, or on
 to add them to the list of
existing columns.
If you want separate statistics for different subsets of data, you can
select a categorical column from the flyout and drop it onto one of the
categorization drop-targets. To categorize by the selected column only, drop
the column on
 , or drop it on
 to add this categorization
to the existing ones. The column should not contain a large number of unique
values, because it will be used to split the selected columns into categories.

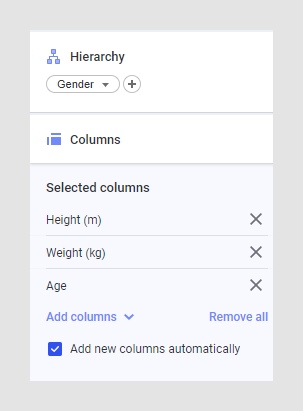
Use the Hierarchy section in the visualization properties panel to add a categorization (or the Categorization selector on the Columns page in the visualization properties dialog).