添加单击图表项目时执行的操作
您可以定义操作,以便在单击图形表或文本区域中的动态项目或单击 KPI 图中的图块时执行某些操作。这些操作可打开能够在已筛选或已标记数据范围内使用、应用标签或者导航到分析中某些页面或图表的 Spotfire 工具,文本区域中的操作控件同样可以执行类似操作。您还可以使用脚本添加自己的自定义操作,或刷新数据函数计算。
关于此任务
开始之前
过程
配置详细图表
以下是您通过在图形表中已计算值类型的两个动态项目上设置 IronPython 脚本操作所能执行操作的示例。
此示例使用包含美国各个州众多产品的销售和成本的虚构数据表。图形表已配置为在“行”轴中显示所有州并已添加了两个计算的值类型的动态项目,分别显示销售总和以及成本总和:
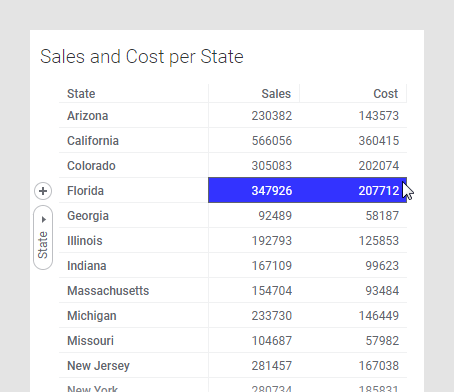
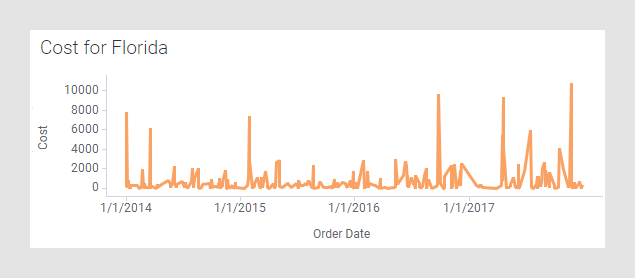
另一图表(折线图)已配置为显示图形表中已标记州在时间推移下的销售总和或成本总和,因此可以显示每个州总和下的详细信息。与由标记控制的标准详细图表不同,此图表显示的数据因您单击的单元格而异;单击“销售额”列将显示该州的销售额,而单击“成本”列将显示成本。
这是通过使用图形表中列上的操作脚本来实现的,该脚本定义了 Y 轴上显示的内容,并通过布尔表达式自动限制折线图,该布尔表达式设置为仅显示图形表中所单击行的州数据。详细图表的标题也由相同的脚本进行更新:
- 从图表属性中,打开第一列“销售额”(在“轴”页面上)的“计算的值设置”对话框,然后转到“操作”部分。
- 选择“单击执行操作”。
- 单击“设置”。
- 单击“脚本”。
- 单击。
- 在“新建脚本”对话框中,键入“脚本名称”(例如“配置详细图表”)。
- 键入“说明”(例如“配置图表以显示图形表单元格的详细信息”)。
- 复制以下脚本并将其粘贴到“脚本”字段。注: 该示例脚本假设数据表中有一个名为“州”的列。
- 单击“脚本参数”旁边的“添加”。
- 在“添加脚本参数”对话框中,键入“名称”
detailsVis,如脚本预期那样。 - 使“类型”为“图表”,并从列表中选择折线图以用作详细图表。
- 单击“确定”关闭所有对话框。
- 同样将定义的脚本添加到其他列,从而能够在折线图中显示销售额或成本详细信息。
# This script is intended to be run as an action on a
# Calculated Value miniature visualization in a graphical
# table.
#
# It expects one Visualization argument, detailsVis, and
# it configures the specified visualization to show details
# for the clicked cell.
#
# When executed as an action in a graphical table,
# the variable Context is bound to an instance of
# MiniatureVisualizationActionContext (see API documentation).

from Spotfire.Dxp.Application.Visuals import VisualContent

# This script assumes that the row axis of the Graphical Table
# is configured with one column: State.
#
# Get the miniature visualization and the value of the row
# axis hierarchy (the state column) for the clicked cell:

clickedMiniVis = Context.Visualization
state = Context.HierarchyPathValues[0]

# Get the content of the visual that shall be configured to
# show details. Use the most general type so that the script
# works for all VisualContent classes that have a Y-axis
# property. This works well for a Line Chart, for instance.

vc = detailsVis.As[VisualContent]()

# Configure the Title and YAxis of the details visualization:

vc.YAxis.Expression = clickedMiniVis.ValueAxis.Expression
detailsVis.Title = clickedMiniVis.Title + " for " + state

# Limit the data of the details visualization to only use
# data for the selected state:

vc.Data.WhereClauseExpression = "State = \"" + state + "\""