Adding data limitations for a visualization
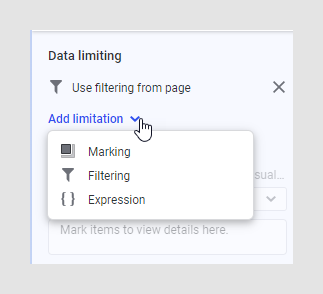
The default behavior when adding a new visualization is that it is automatically updated with the filtering on the page. However, it is possible to change the data limiting so the visualization is not changed by filtering at all, or so that it uses another filtering scheme. You can also make the visualization respond to one or more markings in other visualizations (often called details visualizations). Other options to limit the data is by using expressions, or, for streaming data, by specifying time ranges. You can change the data limitation settings under Data in the Visualization properties.
Procedure
Results
Tip: To remove an added
Data limiting from a visualization, in the
visualization properties, click on the x next to the limiting you want to
remove in the list. See
Making a column not respond to data limiting
to remove data limiting only from one column in a graphical table.

- Using markings for data limiting
A visualization can be configured to show only data that has been marked in another visualization or visualizations, or even show only data that has been marked within the visualization itself. That is, the configured visualization will be based on a limited amount of data, determined by what is currently marked in the limiting visualizations. - Limiting the data in a visualization using filterings
The data limiting settings of a visualization let you define how different filtering schemes in the analysis should affect the visualization. Using data limiting, you can make visualizations on a single page respond to different filtering schemes, or not be affected by filtering at all. - Limiting the data in a visualization using an expression
You can limit what data should be available for a certain visualization using an expression. This way, you can set a "hard filter" on a visualization to make sure that certain values are never included in the calculations behind the visualization, regardless of any filtering in the analysis. - Adding a streaming time range to a visualization
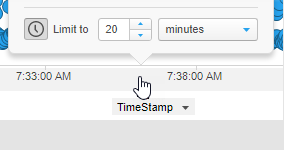
When you are working with streaming data and you want to limit the data in the visualization to a certain time range, you can add a Streaming time range limitation. This way, you can choose to only show data from the latest 5 minutes (or similar).
Parent topic: Working with visualizations

 , and select
