Adding lines using a property
You can use a property as the input to a line or a curve. A property value can either be a string expression in itself, or it can be used as a variable in a custom expression.
Before you begin
Using a property value to define a line in a visualization
The first example describes how the position of a horizontal line in a scatter plot can be changed by anyone using a property control in a text area.
About this task

Follow the steps to create this type of analysis.
Procedure
-
In edit mode,
add the property control to the text area.
In this example, we add an input field.

-
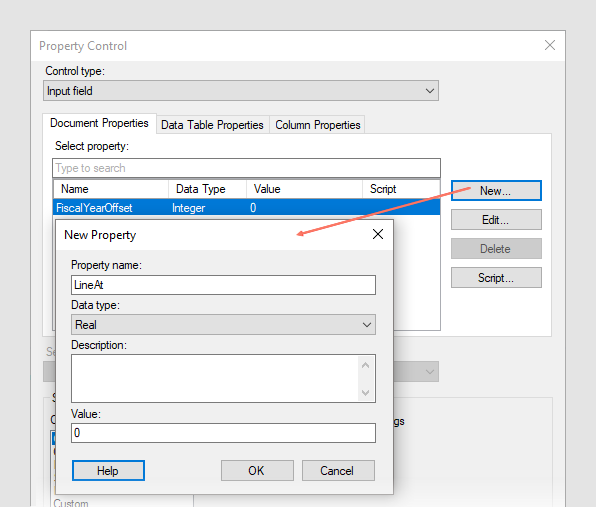
In the
Property Control dialog, create the property
via
New. Give it a name, specify its data type,
and a starting value. In this example, we call the property 'LineAt'.
-
In the
Horizontal Line dialog, select the
Custom expression option, click
Edit and, in the
Custom Expression dialog, enter
${LineAt}.This is the syntax used when adding the value of the property as text in an expression (and also the default if you double-click the property in the Available properties for column list). See Properties in expressions for more information regarding the different syntaxes.
Using a property expression to define a line showing different statistical measures
In this example, a scatter plot is used to show salaries for employees, trellised per education level. The text area contains a property control in the form of a drop-down list, where a dashboard user can select to add horizontal lines that show either the average, the median, or the most common salary within each education level.
About this task

Follow the steps to create this type of analysis.
Procedure
-
In edit mode,
add the property control to the text area.
In this example, we add a drop-down list.

-
In the
Property Control dialog, create the property
via
New. Give it a name, specify its data type,
and a starting value. In this example, we call the property 'SalaryExpression'.

-
Now that the property exists, define which values to include in
the drop-down list. In this example, you define
Fixed values yourself, by typing the text to
show under
Display Name, and by adding their values to
the right.

-
In the
Horizontal Line dialog, select the
Custom expression option, click
Edit and, in the
Custom Expression dialog, enter
${SalaryExpression}([Y]), whereSalaryExpressionis the property you have created (the result of the custom expression${SalaryExpression}([Y])will, depending on the selection in the drop-down list, becomeAvg([Y]),Sum([Y]), orMostCommon([Y])).
-
Click
OK.
The curve is shown in the visualization and you can select where a line should be drawn in the visualization by making a choice in the drop-down list. For example, in the image below, Median salary is selected.

Using a property expression to define a curve
A property can either be a string expression in itself, or it can be used as a variable in a custom expression. This step instruction assumes that the property contains a string which is an expression.