Evaluations of expressions
Depending on how the expression for a calculated column is set up, it is evaluated row by row in the data table, or down an entire column. An expression can also combine these evaluations.
To illustrate how different expression setups are interpreted, the four-row data table below is used.
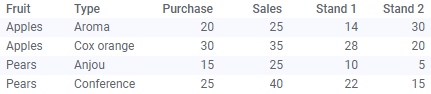
The data table contains purchase and sales figures for four types of fruits. The two columns furthest to the right show the number of fruits that are sold in two different stands.
Evaluation row by row
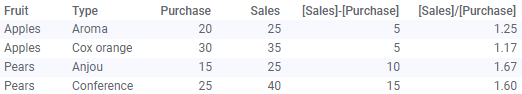
In the image below, two calculated columns have been added to the data table. The expressions used are based on the Sales and Purchase columns. The expression for the first column, [Sales]-[Purchase], calculates the absolute profit per fruit type, and the expression for the second column calculates the relative profit, [Sales]/[Purchase].
These expressions are evaluated row by row. They do not contain any aggregations; the individual row values in the Sales and Purchase columns are inserted in the expressions. For example, in the last row, the [Sales]-[Purchase] column shows 15 (40-25), and the [Sales]/[Purchase] column shows 1.60 (40/25).
If aggregations are used in an expression, however, it is important to keep track of what data is included in the aggregation to understand what values are used in an evaluation.
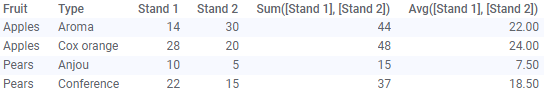
In the next image, the Sum([Stand 1], [Stand 2]) and Avg([Stand 1], [Stand 2]) columns are calculated. When two or more columns are specified within the parenthesis for an aggregation method as in these expressions, then the expression is evaluated row by row.
The expression Sum([Stand 1], [Stand 2]) calculates the total number of fruits that has been sold of each type. For example, in the last row, the total sum is 37 (22+15). The other expression, Avg([Stand 1], [Stand 2]), calculates how many fruits that have been sold in average per stand for each type, such as 18.50 for Conference pears ((22+15)/2).
Evaluation down an entire column
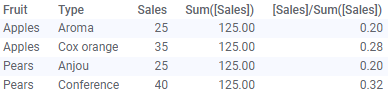
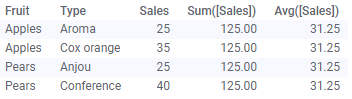
If only one column is specified within the parenthesis for an aggregation, then the expression is evaluated down the column. The expression Sum([Sales]) in the added column below means that the values in the entire Sales column are aggregated into a sum value (125=25+35+25+40). Then this sum value is repeated, because it is the result of the expression for every cell value in the calculated column.
The expression Avg([Sales]) works in the same way (31.25=(25+35+25+40)/4).
Combination of evaluation row by row and down an entire column
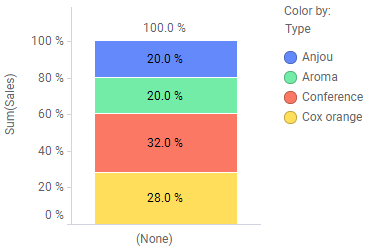
In the image below, the expression [Sales]/Sum([Sales]) for the calculated column furthest to the right combines evaluation row by row and down an entire column. The expression compares the contributions from each fruit type to the total sales on a relative basis. For example, the contribution from Conference pears to the total sales is 32% (40/125).