Example of a line connection in a marker layer
Lines can be drawn in a map layer with markers to show connections between specific markers. You can specify in which order the markers should be connected, and arrows can be added to indicate the direction.
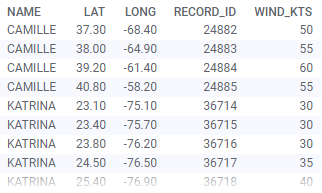
The data table below contains wind force measures at certain "LAT" and
"LONG" coordinates during the advance of two hurricanes, Camille and Katrina.
The "RECORD_ ID" column values keep track of the chronological order of the
measures.

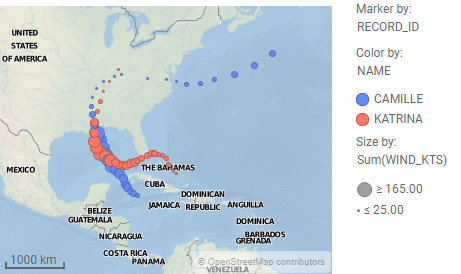
Creation of a marker layer in the map chart will position markers at each of the provided coordinates:

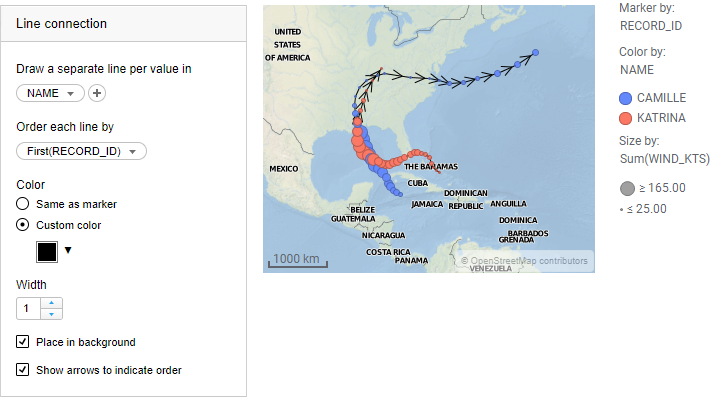
To emphasize the hurricanes' advance, you can connect the markers with lines. The settings are made in the Line connection section in the marker layer Properties:

Separate lines are drawn for the two hurricanes as specified in the topmost setting. The "RECORDED_ID" column, that lists the order of measures, is selected below Order each line by to indicate in which order the markers should be connected. The added lines result in curves that display how each hurricane moves.

Creation of a marker layer in the map chart will position markers at each of the provided coordinates:

To emphasize the hurricanes' advance, you can connect the markers with lines. The settings are made in the Line connection section in the marker layer Properties:

Separate lines are drawn for the two hurricanes as specified in the topmost setting. The "RECORDED_ID" column, that lists the order of measures, is selected below Order each line by to indicate in which order the markers should be connected. The added lines result in curves that display how each hurricane moves.
As shown, line connections can be used to visualize movements. Another use of line connections could be displaying routes between destinations.
Parent topic: Map chart