Handling column selections using a property
This is an example of how you can use a document property to control the column selection of an axis from a text area.
Before you begin
About this task

Follow the steps to create this type of analysis.
Before you begin
Procedure
-
In edit mode,
add the property control to the text area.
In this example, we add a drop-down list.

-
In the
Property Control dialog, the items that should
be available for selection in the drop-down list are defined. However, the
actual property to be controlled does not yet exist. To create it, click
New to open the
New Property dialog, where you give the property
a name and specify its data type. In this example we call it 'SelectColorBy'.

-
When the property exists and has been selected, define the values
the property should be able to have. In this example, the value of the property
is either 'Category' or 'Type', as you want to color the bar chart by either of
these columns. The settings are made in the lower part of the
Property Control dialog. These property values
are set through
Column selection, and an 'or' expression is
used to define the two columns to include.

Tip: You can use any search expression to determine which columns to show in a property control. For example, usedatatype:integerto show integer columns only, usedatatype:realto show real columns only, use"A or B"to show columns beginning with the letters A or B only, and so on. You can also search for a particular column property. The Select Columns dialog is a shortcut to creating column properties and selecting columns based on these properties. For example, useincluded.column:trueif you have added a custom column property calledincluded.columnwith the default valuefalseand the valuetruefor those columns you want to be available. See also Searching in Spotfire clients for more information about search expressions. -
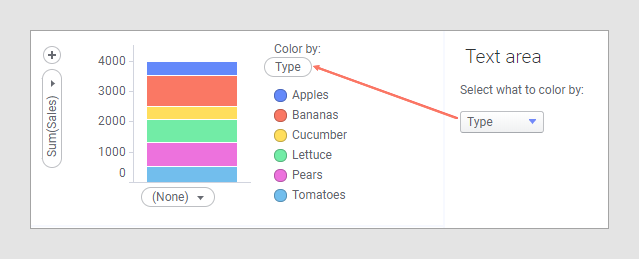
The last step is to connect the property to the place that should
react on the selected property value, in this case the
Color by selector in the bar chart.
Right-click the selector, choose
Set from Property, and select the new
property.

Using multiple document properties to determine the columns to show on an axis
You can add more than one property to an axis expression, if you want the axis to show multiple values or a hierarchy.