Interactive tuning of data functions
When a data function instance has been added to an analysis and the output is a calculated column, or a part of a data table (a new data table, added rows or added columns), and this output is used in a visualization, an analysis author can tune the input values directly from the visualization. This functionality is only available in Editing mode (not for consumer users).
The tuning popover
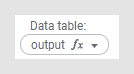
The fx icon can be seen on the column selectors or data table selectors that use the output from the data function. For example, it can be seen on the axis selector, on the color axis (in the legend), or on the data table selector.
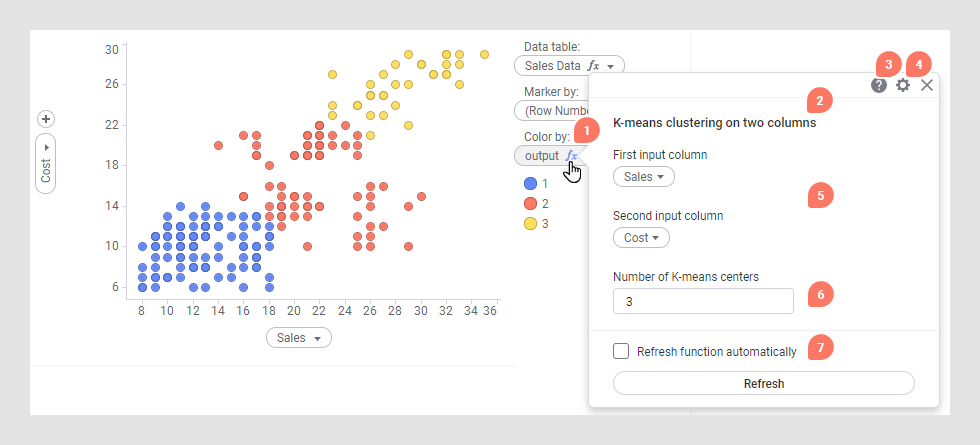
- The access point to the tuning popover in an axis selector.
- The title of the data function you are tuning.
- Information about the popover and a link to this help.
- Opens editing of the data function inputs in the configuration flyout.
- Two examples of column inputs, showing their display names and the input controls you can modify.
- An example of a value control and the display name of the input.
- The option to either refresh automatically or to do a manual refresh is at the bottom of the popover.
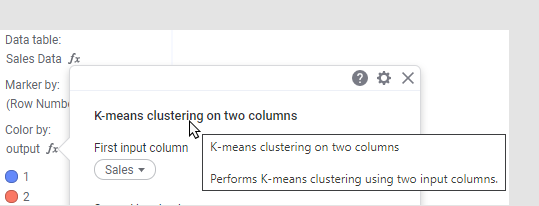
When the tuning popover is open, you can hover with the mouse pointer over the name of the data function, or over the input value name, to see a description (if one has been added by the data function author):
You can also change whether the data function should refresh automatically after changes, or if you want to refresh manually. If you have not enabled automatic refresh, you can click Refresh in the popover to see the updated result directly in your visualizations.
The tuning popover can be dragged to other parts of the analysis to allow you to see the entire visualization while testing different input values.
Close the popover by clicking on the x or clicking outside the popover.
If you need to change more things than those available in the popover, click the Settings icon to open the inputs for editing in the configure data function inputs flyout. You can also edit all parameters from the data function view in the Data canvas.
You can always right-click on a control and select Custom expression to change the input value using your own custom expression. This way, you can actually switch a value input to a column input, if you know what you are doing, or change the data table to pick your columns from.
If you add more than two columns, they will be grouped together. You can click the plus sign to add more columns. For selectors that accept multiple column inputs, you can right-click and choose the Select columns dialog instead, to add many columns simultaneously.
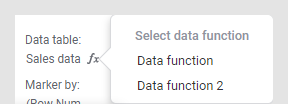
If a data table or a column selector contains outputs from several different data functions, the tuning popover will first allow you to choose which data function to tweak, and then show the input controls for that data function.
Restrictions & considerations
- It is only previously added input values of the data function instances in the analysis that you can tweak from the popover. You cannot add previously ignored optional inputs, or change any ‘Limit by’-settings, or outputs here. Neither can you remove an optional parameter from this access point, if a value has been added to it already. To do such changes, you must edit the input parameters in the configuration flyout (available from the Settings button in the popover or from the data canvas). Output editing is only available from the Data canvas.
- Note that the controls used in the tuning popover might change if you interact with them, or if you close and reopen the popover. For example, if you change an input from a regular column input to a custom expression, the control will be changed from a column input handler to the custom expression handler. Likewise, if an entered custom expression is simple enough it will be reinterpreted as a column input after closing and reopening the popover.
- It is only the lowest level of each control that is shown in the tuning popover, so if you must change the data table from which to select a column, you must either go to full editing or use the custom expression editor.
- Only columns of the allowed data type, as specified by the data function author, will be shown in the column selectors.
- The fx access point is available in all places where the column selector uses web technology. That means that it is available on axes and in the legend in both web and installed clients, but it is only available from within the properties controls when using the web client (not within Visualization Properties in the installed client).
- You cannot cancel a change you make in the tuning popover, but you can always Undo the operation.
See Configuring data functions for a description of the different types of input controls that data functions can have.