In a report, you can export different views of the analysis, where
each view reflects a certain category in a data column. This is done by an
automatic, repeated filtering to one category at a time on selected pages and
visualizations.
About this task
For more
information, see
Contents.
Before you begin
The analysis pages and
individual visualizations you want different views of are listed in the
Selected contents pane.
Procedure
-
In the
Selected contents pane, select the analysis
pages and individual visualizations you want different views of in the export.
-
Click
 in the upper right of
Selected contents.
in the upper right of
Selected contents.
In the
Selected contents pane, a thin frame surrounds
the section showing what to be exported in different views. The
Repeat over filter values
dialog opens.
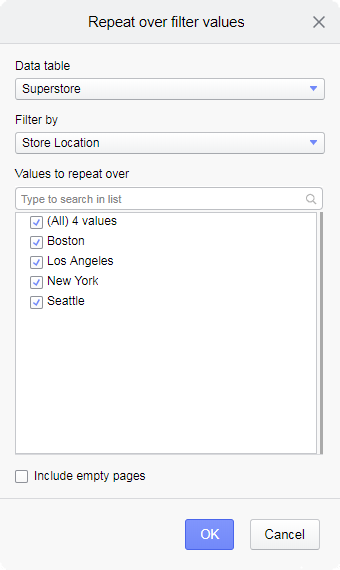
-
If you have more than one data table in the analysis, select the
Data table that contains the column (or
hierarchy), whose categories you are interested in. (This setting is not
visible for analyses based on a single data table.)
-
Beneath
Filter by, select the column or hierarchy that
contains the categories you want to filter to.
Only columns containing categorical values are available for
selection.
The categories you can filter to are listed beneath
Values to repeat over.
-
In
Values to repeat over, select the check boxes
for the categories you want to filter to.
Note: For hierarchies,
you must select
Hierarchy level to repeat over.
Report pages for the selected analysis pages and visualizations
will be created for one category at a time.
-
Combining filters might lead to empty results due to totally
filtered out data. If you want to include also empty results in the report, for
example for reference purpose, select
Include empty pages.
-
Click
OK.
The dialog closes.
-
Click
Save.