Selecting columns on an axis
When creating a visualization, you select which data columns to show on various axes such as on the X-axis, the Y-axis and the color axis.
About this task
 , which displays the
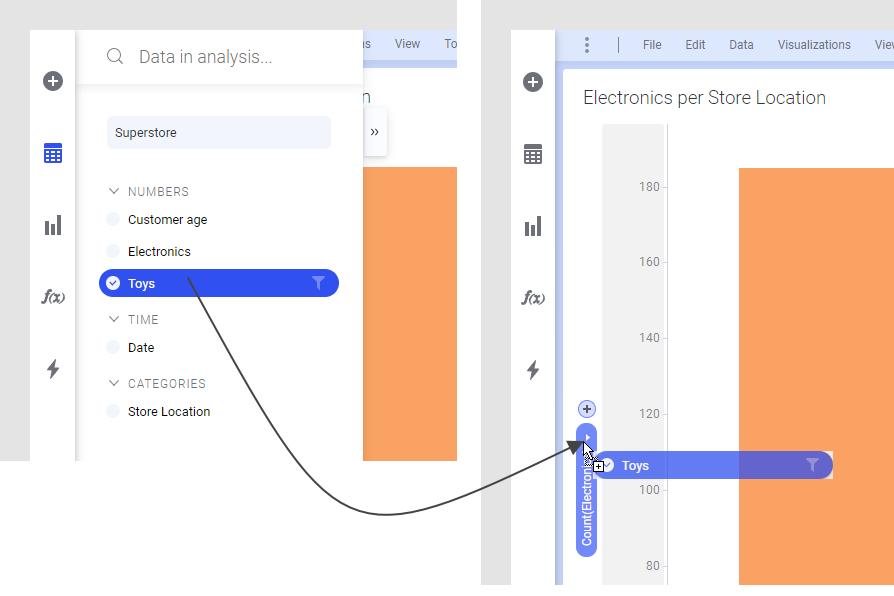
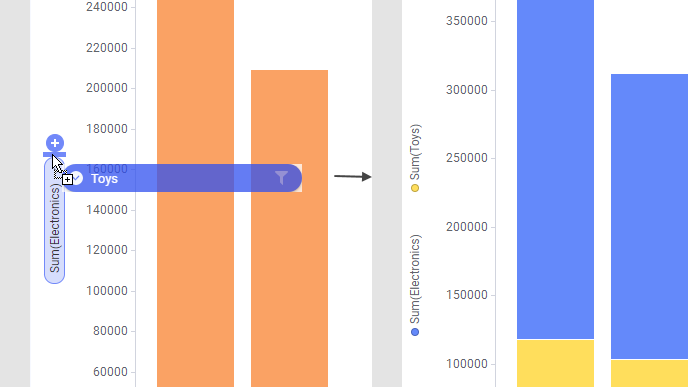
current column. To switch to another column, or add more columns to an axis,
either use the
Data in analysis flyout, or use the column
selector itself.
- Other options than columns in column selectors
You can encounter other options than actual column names in the column selectors. - Changing the column order on an axis
It is possible to change the order of columns on an axis by dragging the columns to other positions. - Column from marked
The Column from marked functionality is a way to look up which column to assign to a column selector by fetching the column name from a cell value in a data table, using marking. The cell would then contain the name of the column you want to assign to an axis in a visualization, such as what to use on the X-axis or what to color by.
Parent topic: Working with visualizations
 on the authoring bar.


