Working with layers
From the visualization properties, you can refine a map chart by reordering layers, hiding layers, or permanently removing layers. You can also show or hide the Layers control from the visualization.
About this task
See Adding layers and subtopics for information about adding layers of different types.
The layers shown in the map chart, top to bottom, correspond to the order of the layer list in the map chart properties, first to last. In other words, placing a layer first in the layer list will place the layer on top of all other layers in the map chart.

Procedure
-
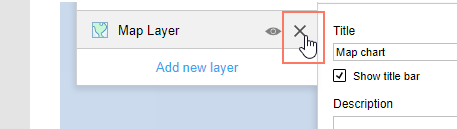
In the web client properties, click the eye icon,
 , or in the installed
client, click the check box next to a layer, to hide the layer.
, or in the installed
client, click the check box next to a layer, to hide the layer.
Results

You can change the Transparency for a selected layer from the Appearance section of the visualization properties panel (or the General page in the visualization properties dialog in the installed client).
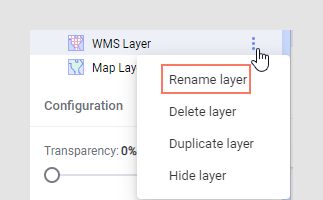
If you no longer need a certain layer, you can also remove it permanently, from the visualization properties.
In the visualization properties panel, this is done by right-clicking on a layer and selecting Delete, or by using the context menu for the layer.


Example: Changing the order of layers in the web client
This example first shows how the marker layer is moved first in the layers list in a web client, so that the markers are placed on top of the map layers Labels, Roads, and Borders. Then the map layer named Roads is temporarily hidden and then shown again.


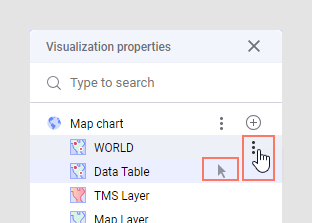
In the visualization properties panel, the interactive layer is indicated using an arrow. You can change to a different (marker or feature) layer from the context menu for that layer, by selecting Use as interactive layer.
Because the column matching allows you to view data from multiple data tables in one visualization, you can use data from one data table to show information in a layer based on a different data table. For example, if you create a feature layer based on a geocoding data table to show different regions in your country, you can use your own sales data table to color the regions.