Wide Data Variable Selector - Correlations
This operator produces a new data set with correlations and significance statistics for each predictor (X) variable against a user-specified dependent (Y) variable from a very large data set, that is, the number of variables could be large - thousands or millions.
![]()
Information at a Glance
|
Parameter |
Description |
|---|---|
| Category | Transform |
| Data source type | TIBCO® Data Virtualization |
| Send output to other operators | Yes |
| Data processing tool | TIBCO® DV, Apache Spark 3.2 or later |
Algorithm
For each predictor (X) variable, the operator computes the correlation (Pearson correlation coefficient) against the dependent (Y) variable. If categorical predictors exist, they are converted to continuous predictors using impact coding before the correlations are calculated. The algorithm makes two passes through the data, one to collect the dependent values and another to calculate the correlations.
Use the following formula to calculate the t statistic for testing the statistical significance of the relationship and corresponding p value calculations.
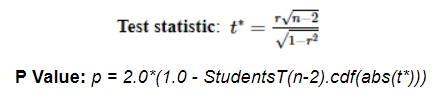
The scalability should not be limited by anything other than available cluster resources.
Input
An input is a single tabular data set that contains key-value pairs of variables and values in a stacked format with variable_names, continuous_values, categorical_values, and row_id columns. The variable_names include the names of all variables (dependent variable as well as predictors), and values for these variables are either in continuous_values or categorical_values columns (this depends on variable type).
The input data set should not contain a column with the name Y or else it results in an error.
One of the continuous_values and categorical_values variables always have missing values - this is as expected based on the structure logic of an input data. If both continuous_values and categorical_values variables are empty, then the point is not used in correlation calculation for the variable in question. In other words, correlations are calculated from all available, and not missing pairs of values separately for each predictor, not dependent on missing values in other predictors.
The operation checks for the validity of the dependent variable specification. See the Algorithm section for more information.
- If the dependent variable is continuous, then it should be in a continuous values column and have numeric values (double, float, long, int).
- If the dependent variable is categorical, then use the Wide Data Variable Selector - Chi Square/Anova operator.
If there is a lack of enough cases to calculate correlation for a variable (at least 2), then the operation returns NaN.
If there is a lack of enough cases to calculate the t statistic and p value (at least 3), then the operation returns 0 and 1 respectively.
Configuration
| Parameter | Description |
|---|---|
| Notes | Notes or helpful information about this operator's parameter settings. When you enter content in the Notes field, a yellow asterisk appears on the operator. |
| Dependent Variable Name | Specify the name of the dependent variable against which the correlation is computed. The dependent variable must be continuous. If the dependent variable is categorical, then use the Wide Data Variable Selector - Chi Square/Anova operator. |
| Variables Column | Specify the name of the column where the variable names are carried. It should contain the name of the dependent variable and predictors. |
| Continuous Values Column |
Specify the column that contains continuous predictors and dependent variable values. |
| Categorical Values Column |
Specify the column that contains the categorical predictor values. |
| Row ID Column | Specify the name of the column that contains the row ID numbers. |
| Number of Folds |
Specify the number of folds used in cross-validated impact coding. The value ranges between 2 and 98. Default: 2 |
| Threshold for Grand Mean Replacement |
Specify an integer threshold value below which the dependent's mean is used as an impact coding value. The value ranges from 0 to the maximum integer value. Default: 1000 |
| Random Seed | The seed used for the pseudo-random generation. The value ranges from 0 to max integer value. |
| Correlation Computation |
Specify the method to use to compute the correlation. It can be either Spark or TDS. Default: Spark |
| Correlation Output |
Specify the correlation output. The following values are available:
Default: Correlations |
| Output Schema | Specify the schema for the output table or view. |
| Output Table | Specify the table path and name where the output of the results is generated. By default, this is a unique table name based on your user ID, workflow ID, and operator. |
| Store Results | When set to Yes, the operator saves the results. If set to No, the operator does not save the results. |
Output
A tabular preview of the output data set that includes the Output and Summary tabs.
-
Summary: The default summary that includes the parameters selected and their values.
-
Output: A single tabular data set containing correlations for each predictor (optionally with t-statistics and its significance).
A single tabular data set that contains correlations of the dependent variable with each predictor (optionally with t-statistics and its p-value).
Example
The following example produces the data set created by correlating each predictor variable against a user-specified dependent variable using the Wide Data Variable Selector - Correlations operator.

Data
A data set contains data in a stacked format where variable names are in the vars column, and the values of these variables are in con_vals (continuous_values) or cat_vals (categorical_values) columns based on the type of variable. The dependent variable in this example is the WIDTH variable.

Parameter Setting
The parameter settings for getting correlations against the WIDTH variable are as follows:
-
Dependent Variable Name: WIDTH
-
Variables Column: vars
-
Continuous Values Column: con_vals
-
Categorical Values Column: cat_vals
-
Row ID Column: id
-
Number of Folds: 2
-
Threshold for Grand Mean Replacement: 1000
-
Random Seed: 0
-
Correlation Computation: TDS
-
Correlation Output: Correlations and t-statistics
-
Store Results: Yes
The following figures display the results from a Wide Data Variable Selector - Correlations operator. You can see one table with the summary of parameters for analysis and one with the actual correlation results. The variable WIDTH is available in the results, even though it is not a predictor. The correlation coefficient of a WIDTH versus WIDTH is logically 1, t-statistics is high, and zero p-values prove that the relationship of variables is statistically significant.
Summary

Output
