Usage Statistics
TIBCO Data Science – Team Studio provides login and activity statistics for users. This helps administrators understand how their system is being used.
- Procedure
- From the sidebar menu, click Administration.
- To see the latest activity aggregates for
TIBCO Data Science – Team Studio users, from the
Application Status list, select
Usage Statistics.
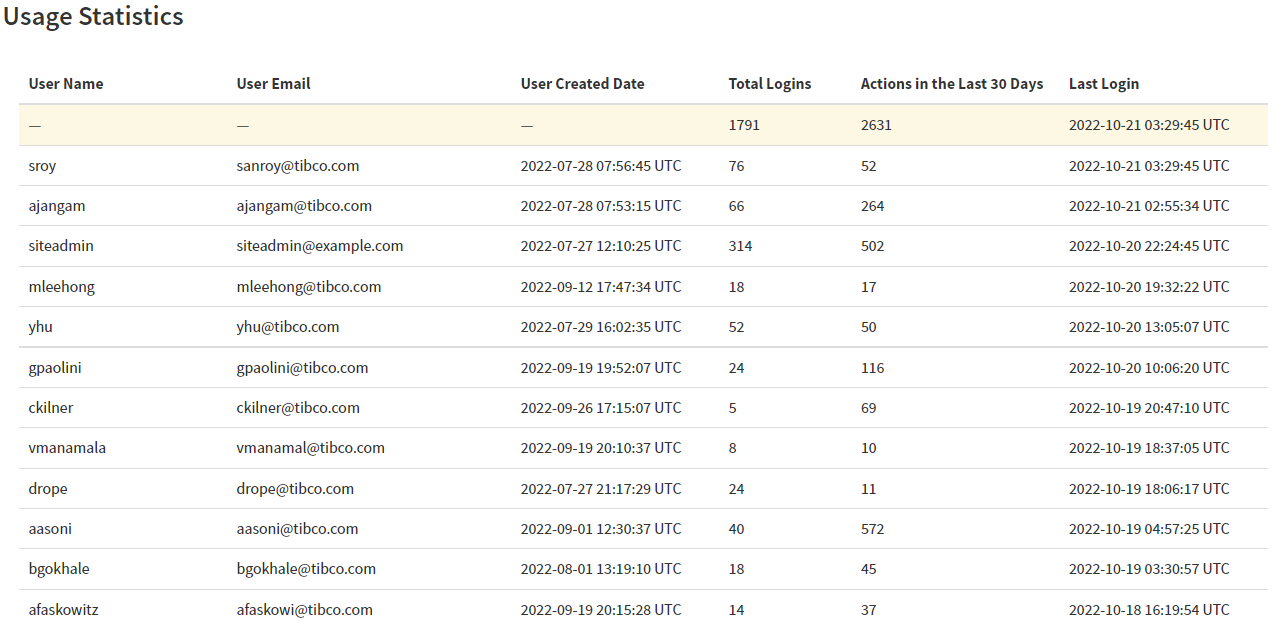
The Usage Statistics page appears. This screen displays information about TIBCO Data Science – Team Studio user activity. The top line, highlighted yellow, shows usage aggregations across all users in your instance of TIBCO Data Science – Team Studio. Each following line shows statistics specific to an individual user.

- User Name: TIBCO Data Science – Team Studio user name.
- User Email: Email address associated with the user account.
- User Created Date: Creation date of the user.
- Total Logins: Total count of logins since the creation date of the user.
- Actions in the Last 30 Days: Rolling count of activities over the past 30 days.
- Last Login: Date of the latest login by the user.
Logins are tracked based on browser sessions when users go through the TIBCO Data Science – Team Studio authentication process, Single-Sign-On, or LDAP authentication.
Activities are counted for each action a user takes while logged in to TIBCO Data Science – Team Studio, including things like saving a workflow, creating a new workspace, changing a data source, and more. This is an aggregated form of the Event Log, highlighted in Administrator Options in TIBCO Data Science – Team Studio.