Contents
You can view performance statistics for a running StreamBase application in several ways with several tools, as described in Monitoring and Profiling Applications in the Administration Guide. This page describes one of those tools, StreamBase Manager.
StreamBase Manager lets you view statistics about the CPU, memory, and parallel region utilization of your StreamBase Server processes and the application components they are hosting. StreamBase Manager is available in two forms:
-
In the SB Manager perspective in StreamBase Studio.
Every time you run, debug, or trace an application in Studio, the SB Manager perspective automatically connects to the running server launched from Studio and displays performance statistics.
-
As a standalone application that runs independently of StreamBase Studio.
Start the standalone StreamBase Manager utility as follows:
- Windows
-
In the Windows Start menu, select >> where
nandmare the major and minor release number of the current StreamBase release. - UNIX
-
Start StreamBase Manager from a UNIX terminal with the following command:
sbmanager &
In both forms, the functionality and views of StreamBase Manager are the same.
StreamBase Studio automatically connects the SB Manager perspective to the running StreamBase Server instance when it launches the server. You only need to switch to the SB Manager perspective to see the monitoring views already running and collecting statistics.
The standalone StreamBase Manager utility does not connect to a StreamBase Server by default. You must establish a connection to a running server instance the first time you run the StreamBase Manager utility. Thereafter, that server's URI is stored for reconnecting.
Follow these steps to connect to a running StreamBase Server instance:
-
If you have never connected to a server, click the To get started link in the Servers view.
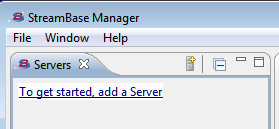
If you have already have a list of servers, invoke the Add Server dialog. Right-click anywhere in the Servers view, and select Add StreamBase Server from the context menu, or click the
 Add StreamBase Server button.
-
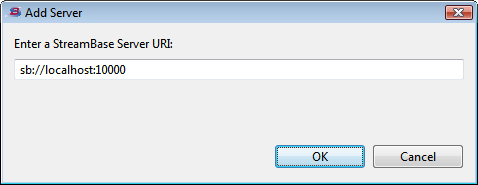
The Add Server dialog automatically contains the default StreamBase URI. Accept this URI if your server is running locally at the default port, or edit the URI to specify a different server or port. Click .
-
StreamBase Manager adds the specified server to its list, but does not yet make a connection.
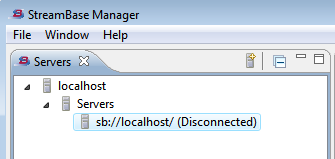
-
To complete the connection, select the server URI, right-click, and select Connect or Connect Automatically.
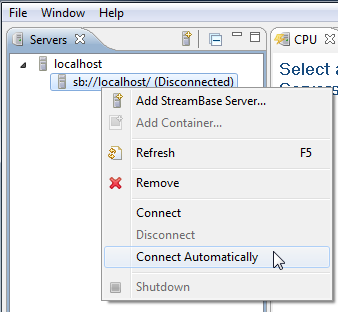
The Connect Automatically option establishes a persistent connection that automatically reconnects if the server restarts and can be quickly reconnected between StreamBase Manager sessions. When you next start StreamBase Manager, you only need to select the server's entry in the Servers view to reestablish the connection.
-
To see the statistics for the specified server, select the connected server name. To see statistics for an individual container running on the server, open the plus sign and select one or more Containers items.
Both the StreamBase Manager utility and the SB Manager perspective have eight views in five panes. The two panes on the right side each share multiple views in tabs.
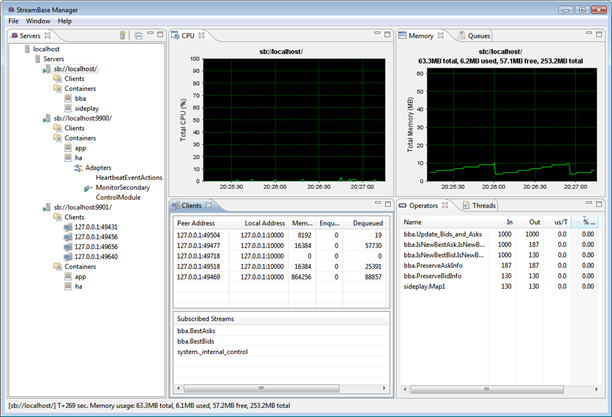 |
StreamBase Manager and the SB Manager perspective have the following views in the main window.
- Servers View
-
Shows a list of StreamBase Servers, the containers on each server, and the clients connecting to each server. Use context menu commands in this view to manage servers and containers.
- CPU View
-
Shows a graph of CPU usage over time on the selected server.
- Memory View
-
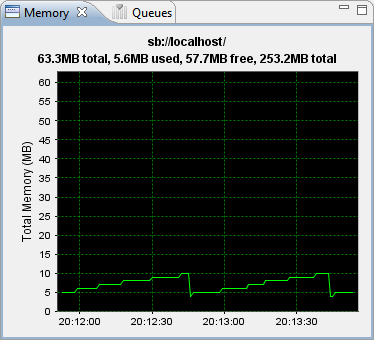
Shows a graph of memory usage on the selected server.
- Clients View
-
Shows statistics about the client connections to the selected server.
- Operators View
-
Shows statistics for the StreamBase operators in the selected server. Select a container name to restrict the list to the selected container.
- Queues View
-
An advanced view for troubleshooting complex StreamBase applications that use concurrency features or container connections.
- Streams View
-
Shows, for the currently connected application, all input and output streams with a count of tuples that have passed through each stream.
- Threads View
-
An advanced view that shows statistics for any parallel regions running in the selected container.
StreamBase Servers collect statistics for every snapshot interval. The default snapshot interval is one second, but you can adjust the length of the interval with the period-ms parameter for the <sbmonitor> element of the server configuration file.
<sbmonitor>
  <param name="period-ms" value="5000"/>
</sbmonitor>
This example sets the snapshot interval to 5 seconds (5000 milliseconds); the default is 1000 milliseconds. For further details, see the <sbmonitor> section of the StreamBase Server Configuration File XML Reference page.
Most statistics shown in StreamBase Manager were collected by the server in the most recent snapshot interval. However, some statistics are cumulative, such as the statistics in the Queues View. Cumulative statistics are collected since the server was started, which is the T+nnn number shown in the top line of the StreamBase Monitor screen.
Several statistics shown by StreamBase Manager are described on this page as a weighted moving average or exponentially weighted moving average. In all cases, these are calculated as an average of 75% of the previously reported snapshot interval, plus 25% of the current snapshot interval. This provides a value calculated from history with weighting similar to that of an exponential distribution. This filters out the effects of transient non-representative extreme values.
The bottom line of the StreamBase Manager window shows the following information:
- [URI]
-
The StreamBase URI of the currently selected server.
- T+nnn sec
-
The uptime in seconds of the currently selected StreamBase Server instance. Cumulative statistics are collected for this time period.
- Memory
-
The memory consumption of the currently selected StreamBase Server instance for the most recent snapshot interval, showing:
-
The total memory allocated by the server for its use.
-
The amount of memory currently used by the server.
-
The amount of memory available to use by the server.
-
The maximum memory allocatable for the server's use. (You can increase this amount by adjusting the
<java-vm>element of the server's configuration file. For details, see the StreamBase Server Configuration XML page in the Reference Guide.)
-
In the Operators, Threads, and Queues views, you can sort columns by clicking the column heading. The selected column immediately becomes the new sort key for the table.
In the Windows version, a triangle pointing up in the column heading means the column is sorted in ascending order. A triangle pointing down means descending order.
To get a better look at a view, double-click its tab. This expands the view to fill the StreamBase Manager window. Double-click the tab again to restore the view to its most recent size.
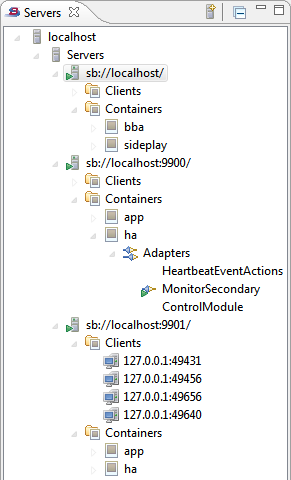
Shows a list of StreamBase Servers with active or recent connections. Servers with active connections are shown with a tree view that opens into a list of containers on that server and a list of connected clients.
Select a server URI to see statistics about that server's applications. Select a container name to restrict the Containers view to information about that container.
 |
You can perform management actions on a selected server or selected container, as described in the following sections.
In the Servers view, select an active server connection and right-click to view the context menu for servers. Perform the following actions from the server context menu:
- Add StreamBase Server
-
Adds another StreamBase Server URI to the Servers view list, as described in Connecting to a StreamBase Server.
- Add Container
-
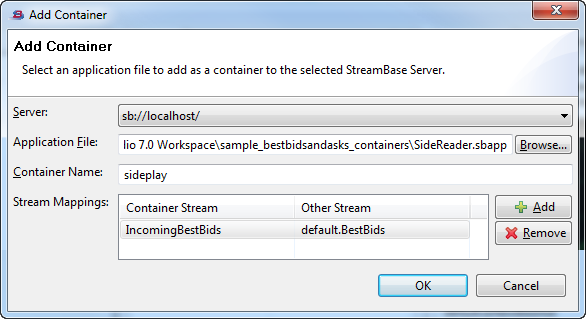
Adds a new container to the selected server, analogous to the sbadmin addContainer command. You must specify a name for the new container and the full local path to a StreamBase application file to run in the new container.
Optional. Use the Stream Mappings section to specify one or more container connections from streams in the new container's application back to streams in an existing container's application. Fields in the Container Stream column are read from the specified application file. Fields in the Other Stream column are a drop-down list of available stream names in existing containers in the running application on the currently selected server. For further information, see the Container Connections page in the Administration Guide.
- Refresh
-
Re-reads the statistics from the selected server.
- Remove
-
Removes the selected server entry from the Servers view list. If the server is currently connected, it is disconnected, then removed. Once removed, you must re-add this server URI to the Servers view list to see statistics from it.
- Connect
-
Connects to the selected server URI. Statistics begin to display when the connection is made.
- Disconnect
-
Disconnects StreamBase Manager from the selected server URI. The server URI remains in the Servers view list.
- Connect Automatically
-
Connects to the selected server URI and stores persistent connection information; statistics from that server begin to display when the connection is made. If the connected server goes down and restarts, StreamBase Manager automatically reconnects and continues monitoring. If you exit and restart StreamBase Manager later, you only need to select the server's entry in the Servers View to reestablish the connection.
- Shutdown
-
Shuts down the selected server, analogous to the sbadmin shutdown command.
Shutting down a server from StreamBase Manager is one-way, which means you can shut down a server but not restart it from StreamBase Manager.

In the Servers view, select a container name and right-click to view the context menu for containers. Simple applications,
and most of the samples shipped with StreamBase, have a single container named default.
Perform the following actions from the container context menu:
- Add StreamBase Server
-
Adds another StreamBase Server URI to the Servers view list, as described in Connecting to a StreamBase Server
- Add Container
-
Adds a new container to the selected server, analogous to the sbadmin addContainer command, as described in the previous section.
- Refresh
-
Re-reads the statistics from the selected server.
- Resume
-
Resumes operation of the application in the specified container, analogous to the sbadmin resume command.
- Suspend
-
Suspends operation of the application in the specified container, analogous to the sbadmin suspend container-name command.
- Shutdown
-
Shuts down the selected container, analogous to the sbadmin shutdown container-name command.
- Remove Container
-
Removes the selected container from the selected server, analogous to the sbadmin removeContainer command.
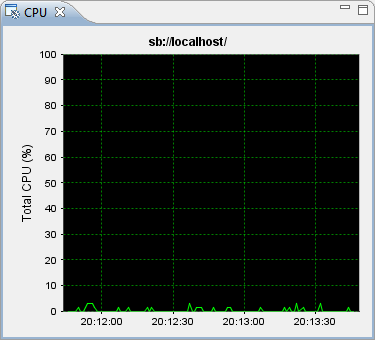
Use the CPU view to assess the use of CPU resources by your application running on the selected server.
 |
Use the Memory view to assess how much RAM is consumed by your application running on the selected server.
 |
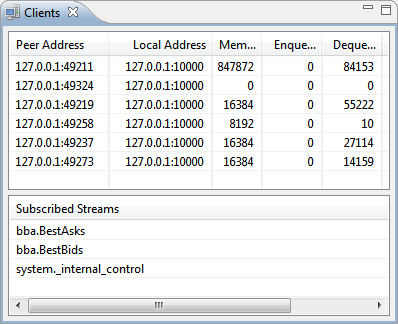
Shows statistics for the client connections to your running StreamBase application, which includes sbc enqueue and sbc dequeue clients as well as custom client applications you have written with the StreamBase Client API. Select a client row to see its subscribed streams in the bottom portion of the view.
 |
-
Peer Address: The IP address and port number of the client side of each client connection. The example above shows clients connecting locally, but client connections can be from any host in your network.
-
Local Address: The IP address and port number of the server side of each client connection.
-
Memory Used: The memory in bytes consumed in the server process by this client connection.
-
Enqueued: The number of tuples that have been enqueued to this client connection.
-
Dequeued: The number of tuples that have been dequeued from this client connection.
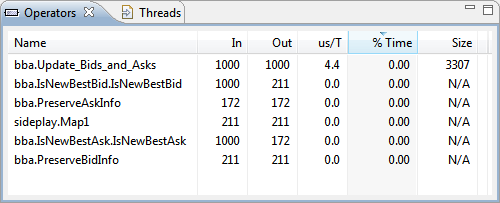
Shows the StreamBase operators currently in use on the selected server. Select a container name in the Servers View tree to restrict the Operators View to only operators in use in the selected container.
 |
-
Name. The name of each operator qualified with its container name.
-
In. The number of tuples enqueued on this operator's input queues during the most recent snapshot interval.
-
Out. The number of tuples output by this operator in the past second.
-
us/T. The exponentially weighted moving average of wall-clock time in microseconds per input tuple.
-
%Time. The current percentage of time spent in this operator.
-
Size. This value is operator dependent. For Query operators, this is the number of rows of the attached Query Table. For Aggregate operators, it is the number of windows open. For all other operators it is 0.
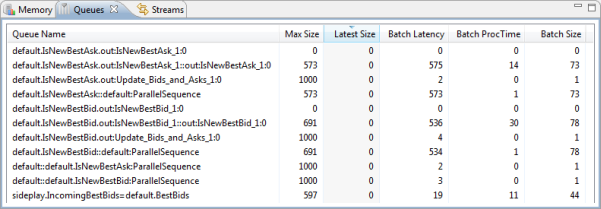
The Queues View is an advanced view for troubleshooting complex StreamBase applications that use concurrency features or container connections between modules. For applications that do not use those features, this view shows your application's input and output streams, including control streams in the system container, and generally shows 0 in the Latest Size column and 1 in the Max Size column.
Queue refers to the queue of tuples waiting to exit a stream. Every input and output stream has a queue, but the queue is normally emptied very quickly as tuples flow smoothly through an application. Thus, in a healthy application, queue sizes should be zero or close to zero. The Queues View helps you diagnose possible bottlenecks in your application by identifying queues with a high tuple count.
In complex applications, the queues of interest in the Queues View are the following:
-
In StreamBase Studio, you can flag most operators and adapters to run in separate parallel regions, using the Concurrency tab of the component's Properties view. See the Execution Order, Concurrency, and Parallelism page in the Administration Guide for a definition of parallel region and for more on using parallel execution.
-
An application configured with multiple containers can have container connections, where the output of a stream in one container is received as input to a stream in another container. If a queue for a stream in a container connection is backing up, it indicates that the downstream container (and its application) are slower than the stream produced by the upstream container. For further information, see the Container Connections page in the Administration Guide.
 |
-
Queue Name. Queue names are shown in a form of StreamBase path notation (as described in the Authoring Guide), and include: the name of each input and output stream in your application, including streams in the system container; the names of each parallel region for operators with parallel execution threads; and the names of container connections.
Queues between components show with a double colon (
::) between the affected components. Container connections show with an equals sign (=) between the two streams of the connection. An underline-number appendix designates that operator's port number; thus_1for port 1. For operators running in separate parallel regions, a zero-based region instance number is appended in the form:.instanceNumber -
Max Size. Maximum size, the number of tuples enqueued for this stream since the connected server started.
-
Latest Size. Current size, the approximate number of tuples currently waiting in the queue for this stream. The number is approximate because there can be multiple parallel regions accessing the queue at the same time.
-
Batch Latency. The moving average of the time in microseconds for a batch of tuples to traverse the queue.
-
Batch ProcTime. Processing time, the moving average of the time in microseconds that it takes to process a batch of tuples.
-
Batch Size. A moving average of the size of a batch of tuples in the queue, in number of tuples.
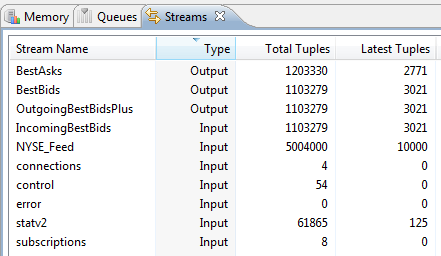
The Streams View lists the streams in the currently selected StreamBase application. The view shows whether each stream is an input or output stream, and shows a count of tuples that have passed through each stream: both the total number of tuples since the application started, and the total number of tuples in the most recent snapshot interval.
 |
-
Stream Name. The name of each input, output, and control stream in the running application.
-
Type. Whether the named stream is an input or output stream. System streams from the
systemcontainer are shown as input streams. -
Total Tuples. The total number of tuples passing through each stream since the application started.
-
Latest Tuples. The number of tuples passing through each stream in the most recent snapshot interval.
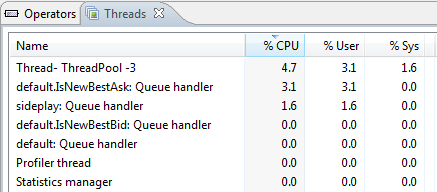
The Threads View is an advanced view that shows information about threads used by components in the currently selected StreamBase application. This view is of particular interest when your application uses the data concurrency option for operators and adapters. See the Execution Order, Concurrency, and Parallelism page in the Authoring Guide for more on using parallel execution.
 |
