To be able to debug an extension with the installed Windows
client, the extension must be packaged as a Spotfire Module, that is, placed in
a separate folder with a file called
module.xml that contains metadata for the module.
Procedure
-
Open the solution in Visual Studio.
-
In the
Solution Explorer, right-click the project, and
then select
Properties.
-
On the
Debug page, click
Open debug launch profiles UI.
-
In the Launch Profiles dialog, click
Create a new profile, and choose
Executable.
-
For your new profile, under Executable, point to a
Spotfire.Dxp.exe on your computer. It could be
your installed version, some intermediate beta-version or similar.
For example:
C:\Users\{username}\AppData\Local\Spotfire\{version}\Spotfire.Dxp.exe
-
Under
Command line arguments, enter
/loadallmodules /addmodulefolder:<path to the
				Module-folder in your SDK>
.
For example:
/loadallmodules
				/addmodulefolder:C:\SpotfireSDK\SDK\MyExtensions\Build\Modules
Note: If the path contains a whitespace, it must be surrounded by
quotes. For example:/loadallmodules /addmodulefolder:"C:\Spotfire
SDK\SDK\MyExtensions\Build\Modules"
The argument
/loadallmodules forces Spotfire to load the
highest version of all modules it can find in the set of module-folders,
regardless of the deployed packages on the selected deployment area.
The argument
/addmodulefolder adds a path to a folder where
Spotfire should search for modules to load. The argument can be repeated if
more folders must be added.
-
Close the dialog.
-
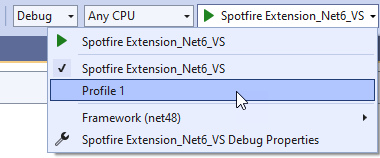
To verify that the extension is actually loaded, select the new
Debug profile in Visual Studio and run it. Make sure that Spotfire is launched.
-
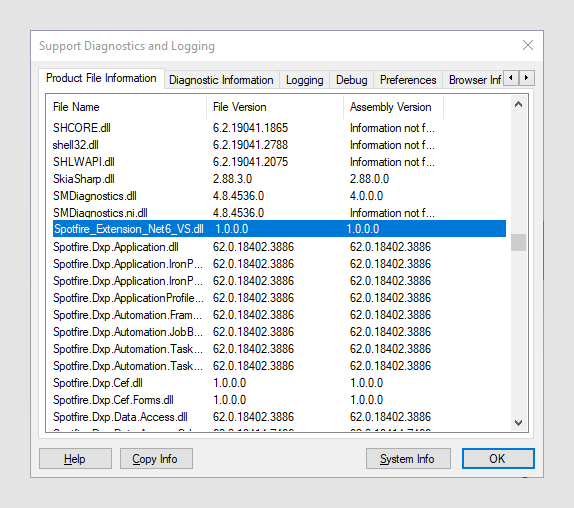
In Spotfire, under
, scroll down the list of
loaded files to verify that your extension has been loaded.