The Data panel is used to get an overview of the columns in all data tables, in-memory as well as in-database (in-db). When working with in-database data the Data panel is the starting point for configuring both visualizations and the filters panel, since no filters are created automatically for external data. Depending on the data source, there will be different sections available for a selected data table.
Oracle Essbase Data
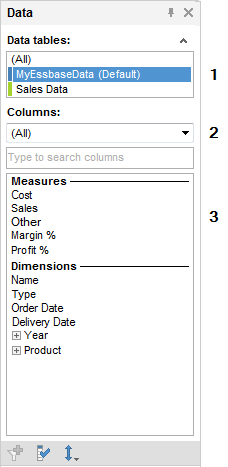
When you are working with Oracle Essbase data, the Data panel will look something like this:
Number |
Section |
Description |
1 |
Data tables |
[Only available if more than one data table has been added to the analysis.] Lists all data tables in the analysis. Related tables have the same color on the color stripe. |
2 |
[Drop-down list] |
Allows you to select to show either all columns or just Measures or Dimensions in the list of columns below. |
3 |
Columns |
Depending on the selection made in the drop-down list either all measures and dimensions available in the selected database or only measures or dimensions are shown. Note that if all columns are shown, measures and dimensions are divided into two different groups, in order to help you setting up relevant visualizations. |
Toolbar
All flavors of the Data panel have a toolbar at the bottom of the panel:
Button |
Description |
|
[Only available for in-db data tables and only for columns that currently do not have a corresponding filter.] Creates a filter for the selected columns. Tip: To delete a filter, right-click on the filter in the Filters panel and select Delete Filter from the pop-up menu. Note: When working with Oracle Essbase data it is not possible to create filters for measures, only for dimension columns. |
|
Opens the Column Properties dialog where you can view detailed information about all columns, change the name of a column, add custom column properties, etc. |
|
Allows you to change the sorting of the columns in the list from the original database sorting to an Ascending or Descending alphabetical order. The different types of columns are sorted respectively within their section. |
You can use drag-and-drop from the Data panel to configure visualizations or to create filters. If hierarchies are available in the data panel columns list, they can also be dragged and dropped to utilize a hierarchy slider in a visualization.
See also:
Details on Oracle Essbase Connection


