
A data connection is used when you are analyzing massive amounts of data and you need to keep the underlying data in the database (in-db) rather than bringing it into Spotfire's internal data engine. However, you can also select to import data tables from data connections. Both imported and in-db data tables from a relational connection can be set up to be loaded on demand only. On-demand is not available for cube connections.
The data connection consists of two parts:
One or more data tables which may or may not be used by the analysis.
Both the connection data source and the data connection itself can be shared in the library, if desired.
The table below describes different configuration scenarios.
Spotfire Analysis |
Data Connection |
Connection Data Source |
|
Shared in library |
Shared in library |
|
Shared in library |
Embedded in connection |
|
Embedded in analysis |
Shared in library |
|
Embedded in analysis |
Embedded in connection |
When your analyses use shared data connections you can easily update the data in a large number of analyses simultaneously by updating the data connection.
The data connections may either contain an embedded connection data source or a shared connection data source. When it comes to editing, a shared data source may temporarily be embedded in the connection, if necessary.
If your analysis contains a shared data connection you may still be able to use a cached version of the data connection if you are offline. However, this may result in inconsistencies with the expected data from the data connection on the library if the cached data is out of date.
Views in the Connection
A data connection from a cube data source always consists of a single view or data table, which combines all of the information from the selected cube, or part of the cube into one data table.
Data connections based on relational databases may contain one or more views, which may be used as data tables in the analysis. Each of the views may also be built by more than one of the source tables from the database, joined into a single view using structural relations. These relations may have been set up by the database administrator in the database but they may also be manually created in the Views in Connection dialog.
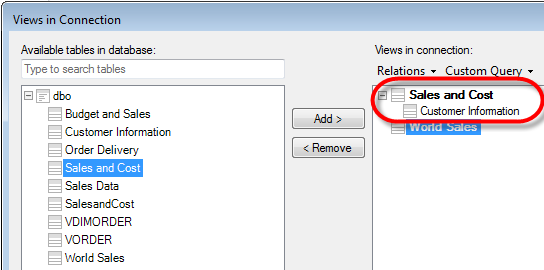
The selection of which data tables should be available in the analysis is also done in the Views in Connection dialog. In the image above, the data connection will create two views and one of those is a view combined by two related source tables. Data connections shared in the library contain a specified set of views, but data connections that are embedded in the current analysis can be edited within the context of the analysis and the currently used views in the connection can be updated. You can always embed a data connection in the Data Connection Settings dialog if you need to make any changes to the data tables in this particular analysis.
If you want to add data tables based on a view that is included in a connection already added to an analysis, you should use the Add Data Tables > From Analysis option, rather than adding a second connection based on the same source. Because the addition of a connection to an analysis adds all views available in that connection, you already have access to all of those views in the analysis and you only need to create a new data table from it. Adding a second connection based on the same data would create another set of views and, hence, increase the impact of the analysis on the external system.
Prompting and On-demand
Prompting and on-demand loading are two ways to give the end user of an analysis the chance to select which data from a data source to analyze. When you define prompting for a data connection you always save the prompt configuration within the data connection itself. This means that all analyses that use a prompted data connection will request the end users for input when the analysis is opened.
However, on-demand loading is defined in the analysis. If you want to configure on-demand loading for an analysis based on a prompted data connection, then you can override the prompting by defining on-demand loading for the parameter which was configured with a prompt in the data connection.
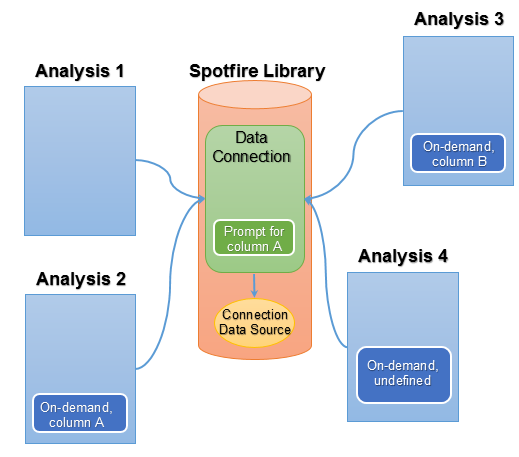
In the image above, Analysis 1 prompts for input when the analysis is opened. It has no on-demand data tables at all, so the prompting is the only limitation done.
Analysis 2 has been configured with on-demand loading of the data from the data connection, and the same parameter that was configured with a prompt has been used to define on-demand loading (for example, selection is done by marking values in another data table). This means that the prompt is overridden and the input for parameter A will come from the defined on-demand input rather than from prompting.
Analysis 3 is configured to use on-demand loading, but the on-demand loading is based on input values for column B. In this case, the analysis will prompt for input to column A, and the limitations for the on-demand data table are solely based on selection of values for column B.
Analysis 4 is configured to use on-demand loading, but no on-demand parameters have been defined. In this case, only the prompting will take effect when data is loaded.


