Option |
Description |
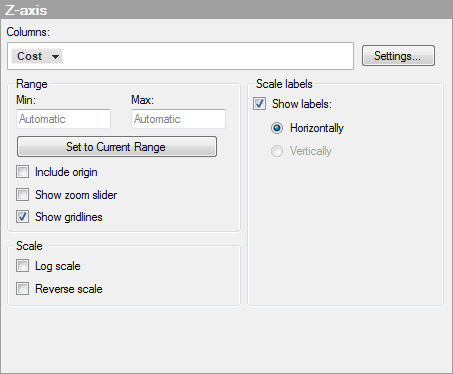
Columns |
Specifies the column or hierarchy to be displayed on the Z-axis. |
Settings... |
Opens the Advanced Settings dialog where you can change the scale mode from categorical to continuous and vice versa, as well as changing the category mode to determine which combinations to show. |
Range |
|
Min |
Determines the lower value of the axis range. Leave the field blank to automatically adjust the range to the currently lowest value in the filtered data. |
Max |
Determines the upper value of the axis range. Leave the field blank to automatically adjust the range to the currently highest value in the filtered data. |
Set
to Current Range |
Allows you to set the axis range to the currently filtered values. |
Include
origin |
Available for continuous columns only. Always includes the coordinates (0, 0) in the visualization, regardless of filtering. |
Show
zoom slider |
Shows a zoom slider that you can manually manipulate to view only the interesting segments of the 3D scatter plot. |
Show
gridlines |
Specifies whether or not horizontal gridlines should be visible. |
Scale
labels |
|
Show
labels |
Specifies whether or not scale labels should be visible. |
Horizontally |
Specifies that scale labels are shown horizontally. Note: In the 3D scatter plot you cannot change this setting. |
Vertically |
This alternative is inactive, since it is not possible to change this setting in the 3D scatter plot. |
Scale |
|
Log
scale |
Changes the scale from a linear scale to a logarithmic base 10 scale [log10 (x)]. |
Reverse
scale |
Reverses the current sort order so that the lowest value is displayed at the top of the scale. |
See also: