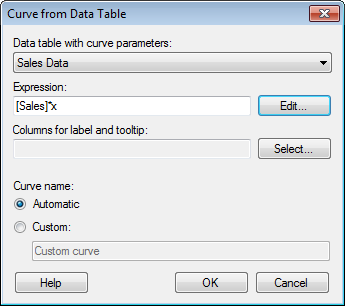
This dialog is shown when you add or edit a curve from data table from the Lines & Curves page of the Visualization Properties dialog (only available for some visualization types). It allows you to specify a custom curve expression which makes use of parameters available in a specified data table.
Option |
Description |
Data
table with curve parameters |
Lists the available data tables in the analysis. Select the data table that contains the curve parameters you wish to use in the definition of the curve. |
Expression |
Type the curve expression containing the independent variable (normally x) and any other parameters that are defined in the selected data table. All variables in the expression, except for the independent variable, must have corresponding columns in the parameter table. Note: The columns that are used for relations between the data table and the parameter table cannot be used as variables in the expression or as result variables. |
Edit... |
Opens the Edit Expression dialog where you can select between columns and functions to define your expression. |
Columns
for label and tooltip |
Lists the columns from the data table selected above that also should be used in the label and/or tooltip for the curve. You can change whether to display the contents from the column in the label, in the tooltip or in both using the Label and Tooltip dialog. |
Select... |
Opens the Select Columns dialog where you can select the columns that should be possible to use in the label and/or tooltip for a curve. |
Curve
name |
Specifies whether an Automatic line name should be created, or whether you instead wish to type a Custom line name. |
See also: