This dialog handles what should be shown in the label and/or tooltip of a selected line, curve or point.
To reach the Label and Tooltip dialog:
In the Visualization Properties dialog of a visualization that supports lines and curves, go to the Lines & Curves page.
Click to select the line or curve of interest in the Visible lines and curves list.
Click on the Label and Tooltip... button under Settings.
Option |
Description |
Display
the following values |
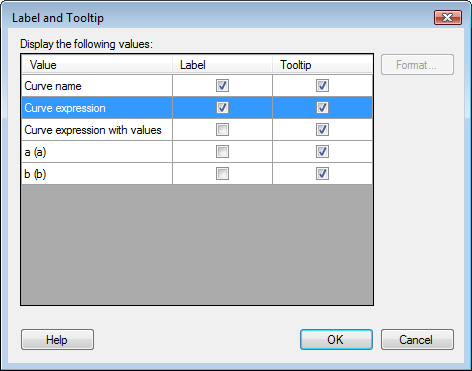
Lists the available values that can be selected to be displayed in the label, tooltip or both. For Line from Data Table and Curve from Data Table you can make columns from the additional data table available here while setting up the line or curve using the Columns for label and tooltip field. Select the corresponding check box to include a value in the label or tooltip. |
Format... |
Opens the Formatting dialog where you can change the value formatting of the values in the curve expression. |
See also: