The OVER statement is used in many of the more advanced custom expressions. In this section, several node and time period methods are explained.
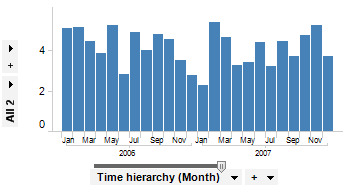
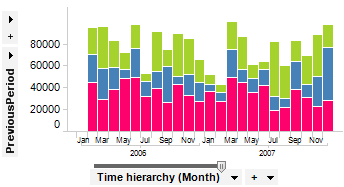
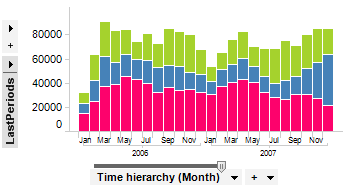
In the examples below, a bar chart with a Year/Month hierarchy on the category axis is used, and in most cases it is colored by Product.
Note: When working with in-db data you must always apply OVER expressions to the already aggregated data using the THEN keyword, since there is no row-level data available in that case. This expression structure can also improve the performance when working with in-memory data. See Using Expressions on Aggregated Data (the THEN Keyword) for more information.
For some of the methods, there is more than one example and many have a more general illustration of how they work.
Node methods
Node methods can refer to other nodes relative to the current node based on the position in the hierarchy.
Method |
Description |
Parent Method |
Uses the parent subset of the current node to perform the calculation. If the node does not have a parent, all rows are used as the subset.
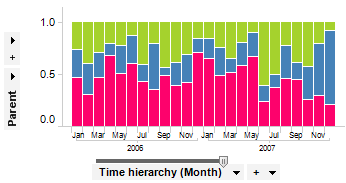
It can be used to show how much of the total sales each product category represent each month. Sum([Sales]) / Sum([Sales]) OVER (Parent([Axis.Color]))
Note: In this example, Parent refers to what the color is set to, which is Product.
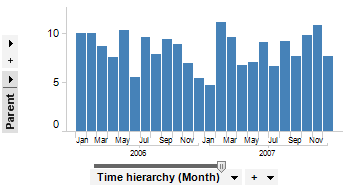
As an additional example, if you wish to see the percentage of all sales for each month of each year, regardless of product category, you can create the following custom expression. Sum([Sales]) / Sum([Sales]) OVER (Parent([Axis.X])) * 100
|
Next Method |
Compares the current node with the next node on the same level in the hierarchy.
If there is no next node, that is, if the current node is the last node for the current level, the resulting subset will not contain any rows.
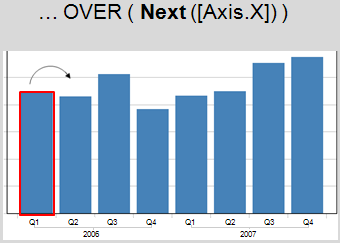
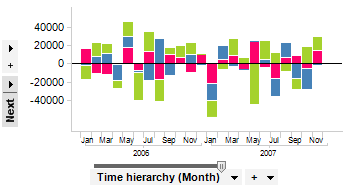
Sum([Sales]) - Sum([Sales]) OVER (Next([Axis.X]))
If the current node is 2004.Jan, in the figure at the top of the page, 'next' in this case will refer to 2004.March, since 2004.February is missing in the data. See Next Period method for value based reference. |
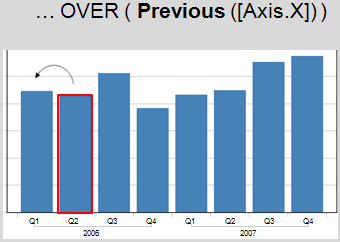
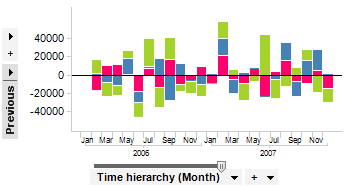
Previous Method
|
Uses the previous node on the same level as the current node to compare the result of the current node with the previous one.
If there is no previous node, that is, if the current node is the first node for the current level, the resulting subset will not contain any rows.
Sum([Sales]) - Sum([Sales]) OVER (Previous([Axis.X]))
|
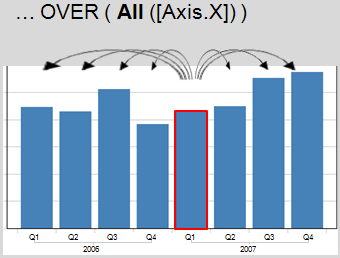
AllMethod
|
The All method uses all the nodes in the referenced hierarchy:
This can be useful when intersecting the current node with more than one hierarchy.
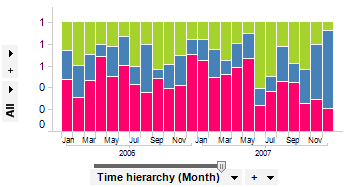
In this example, the bar chart shows the relative sales of the different product categories for each month. Sum([Sales]) / Sum([Sales]) OVER (Intersect(All([Axis.Color]), [Axis.X]))
Note: See the Intersect Method for information on that method.
Another example is if you want to see the percentage of all sales for each month over the years. Regardless of product category. Sum([Sales]) / Sum([Sales]) OVER (All([Axis.X])) * 100
|
|
|
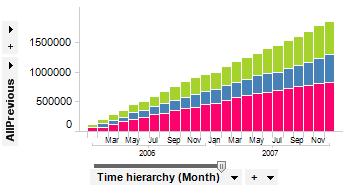
Uses all nodes, including the current, from the start of the level.
This can be used to calculate the cumulative sum. Sum([Sales]) OVER (AllPrevious([Axis.X]))
Tip: A basic Cumulative Sum expression can easily be created using the shortcut in the Aggregation menu on the axis selector.
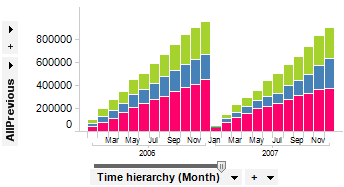
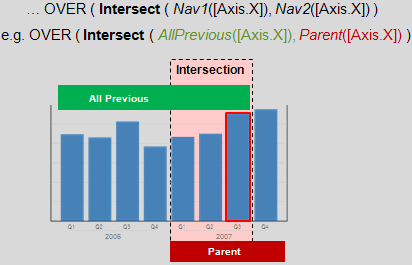
If you want to limit the cumulative sum for current year you can combine the All Previous Method with the Intersect Method: Sum([Sales]) OVER (Intersect(Parent([Axis.X]), AllPrevious([Axis.X])))
Note: See the Intersect Method for information on that method. |
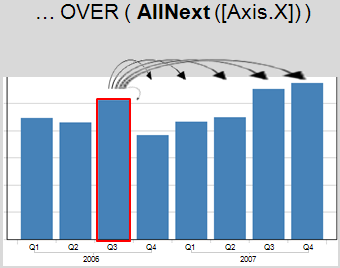
AllNext Method |
Uses all nodes, including the current, to the end of the level.
|
Intersect Method |
Returns the intersected rows from nodes in different hierarchies.
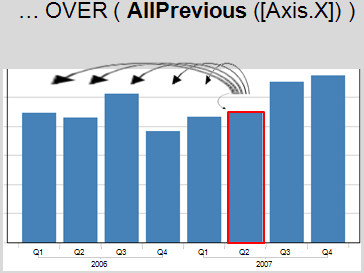
See also the All Previous Method and the All
Method for examples of how it works. |
Node navigation methods
Node navigation methods can refer to other nodes relative to the current node based on the value in the current node and the other relative nodes.
Method |
Description |
FirstNode method |
Navigates to the first node in the current level on the specified axis. FirstNode([Axis.X]) |
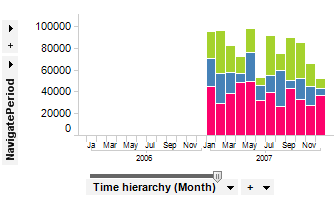
NavigatePeriod Method |
This method allows you to specify your own node navigation. It allows you to select a subset of the underlying data corresponding to a hierarchy node reached by navigating up from the current node, then sideways and finally down along a path corresponding to that previously navigated up. If a corresponding node in the path cannot be found (e.g., if data for one month is missing) then no nodes will be selected and there will be no value for the current node The method can be called with three or four arguments: Arg1: The hierarchy to navigate, typically [Axis.X] or similar. Arg2: The name of the level in the hierarchy to move up to. For example, “Year”, provided that there is a Year>>Quarter>>Month hierarchy on the X-axis. This argument can also be specified with an integer denoting the number of steps to move to move up from the leaf level. Arg3: The number steps to move sideways in the hierarchy at the level specified by the first argument. For example, -1 moves to the previous node. Arg4: The name of the level in the hierarchy to move down to, or an integer specifying the number of steps to move down. This argument can be omitted in which case a navigation to the leaf level is made.
Examples, assuming that there is a Year>>Quarter>>Month hierarchy on the X-axis:
Sum all values in the corresponding quarter of the previous year: Sum([Value]) OVER NavigatePeriod([Axis.X], "Year", -1, "Quarter")
Sum all values in the current year: Sum([Value]) OVER NavigatePeriod([Axis.X], "Year", 0, 0)
Sum all values in the corresponding quarter and month of the previous year: Sum([Value]) OVER NavigatePeriod([Axis.X], "Year", -1)
Use NavigatePeriod([Axis.X], "Year", 0, 0) to select everything for that year. |
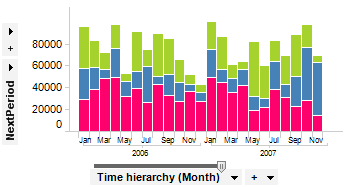
NextPeriod Method |
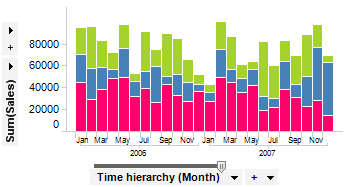
Uses the next node which has the next value (defined as the next value index) on the same level as the current node to perform the calculation. If there is no next node, that is, if the current node is the last node for the current level, the resulting subset will not contain any rows. For example, as seen in the image below, December 2006 will have a value, but December 2007 will not, since there is no data available for January 2008 in the visualization. Sum([Sales]) OVER (NextPeriod([Axis.X]))
|
PreviousPeriod Method |
Uses the previous node which has the previous value (defined as the previous value index) on the same level as the current node to perform the calculation. If there is no previous node, that is, if the current node is the first node for the current level, the resulting subset will not contain any rows. Sum([Sales]) OVER (PreviousPeriod([Axis.X]))
|
ParallelPeriod Method
|
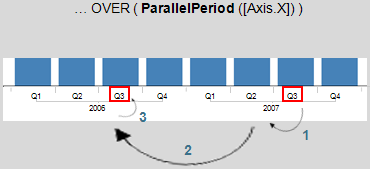
Uses the previous parallel node with the same value (defined as having the same value index) on the same level as the current node.
Note: The method only looks for a node with the same value as the current node in the children to the previous parent node. That means that it only looks one level above the current node. Therefore, a hierarchy with year as the parent node and quarter OR month as nodes on the lower level will work since the nodes under each year will have the same values. However, a hierarchy with all three levels would not work for this method since the months under Q2 and Q3, for example, do not have the same values.
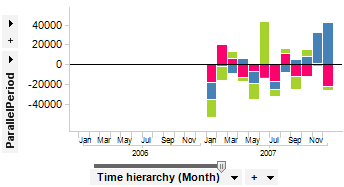
This can be used to compare sales results for each month with the corresponding months the previous year. Sum([Sales])-Sum([Sales]) OVER (ParallelPeriod([Axis.X]))
|
LastNode Method |
Navigates to the last node in the current level on the specified axis. LastNode([Axis.X]) |
LastPeriods Method |
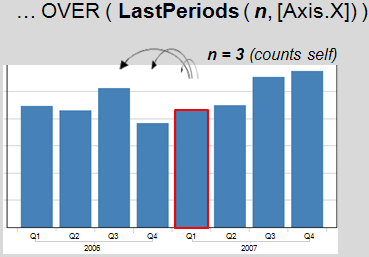
Includes the current node and the n - 1 previous nodes (as defined by the each node value index).
This can be used to calculate moving averages. Sum([Sales]) OVER (LastPeriods(3, [Axis.X]))/3
|
Note: All time period methods return the resulting visualization item subset, so the use of aggregation methods like average might not produce the expected result. See also Working with Time Hierarchies for more information about missing values in time series.
See also:
Custom Expressions Introduction
How to Insert a Custom Expression