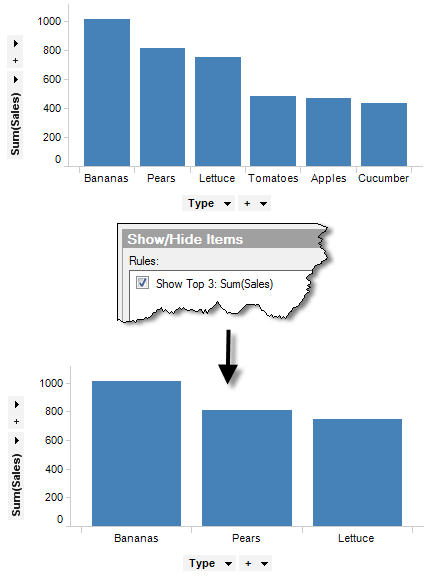
When you filter out values in the Filters panel you change the underlying data used to calculate the items available in a visualization. However, sometimes you may want the calculations to be exactly the way they are, but you are only interested in some of the values in the resulting visualization. This is when you can use Show/Hide Items. In the example below, a simple rule is applied, so that only the top three highest bars are shown:
The Show/Hide Items tab is available in the Visualization Properties dialog for most visualization types. Once a rule has been defined, it can be temporarily disabled using the check box on the Show/Hide Items tab.
Tip: When Show/Hide rules have been applied in a visualization you may want to let others know that not all data is shown in the visualization. You can type this information in the title or description of the visualization.
Rule Order
You can apply one or more rules to the visualization where you select either to show or hide some of the items (e.g., bars, markers or sectors) from the visualization. The order of the rules in the Show/Hide Items tab determines which rule should be applied if multiple rules affect the same item: They are always prioritized from top to bottom so the top rule will determine whether an item should be shown or hidden.
The last active rule in the list determines whether or not items that are not matched by any rule should be shown or hidden: If the last active rule hides items, then the unmatched items will be shown. If the last active rule shows items, then the unmatched items are hidden.
This may have some implications on visualizations where multiple rules are used and some of them contradict each other. For example, using the same data as above and applying Show Top 2 and Hide Bottom 2 rules simultaneously will give the following results, depending on the order of the rules:
Rule Order |
Result |
What is happening? |
Show Top 2: Sum(Sales) Hide Bottom 2: Sum(Sales)
|
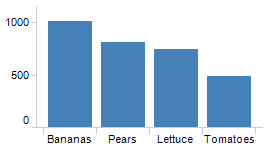 |
Since the last rule is a hide rule, the third bar, Lettuce and the fourth bar, Tomatoes will be shown, even though they should be hidden according to the first rule. This is because those two bars are not affected directly by any of the rules and the last rule explicitly hides the two very last bars. |
Hide Bottom 2: Sum(Sales) Show Top 2: Sum(Sales)
|
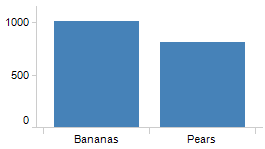 |
Since the last rule is a show rule, all bars will be hidden except for the first two bars. Those bars that were not explicitly shown will be hidden. |
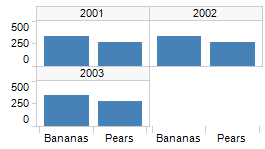
Trellising
If you are using trellised visualizations, you can select whether or not the rule should apply to each trellis panel separately when setting up the rule:
Coloring Rules
Setting |
Result |
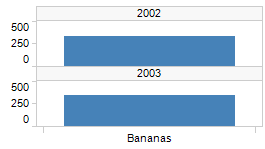
The visualization displays the two product types that sold best during the years. In this example, the top two bars were the Bananas sales in 2002 and 2003.
|
|
The visualization displays the two product categories that sold best each year. Here, it was Bananas and Pears for all of the available years.
|
|
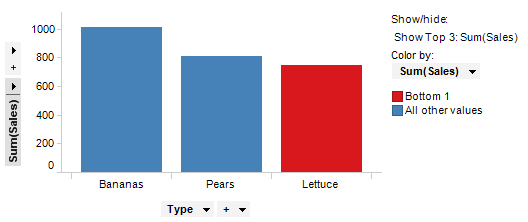
The show/hide rules also work great together with coloring rules. When Show/Hide rules are combined with coloring rules, the Show/Hide rules are applied first and the color rules applied to the result after the Show/Hide rules have been applied. This means that if you set up a Show/Hide rule showing Top 3 and a Color rule, coloring the Bottom 1 item in red, the red item will be the last one of the top 3:
Rules Work on the Smallest Items
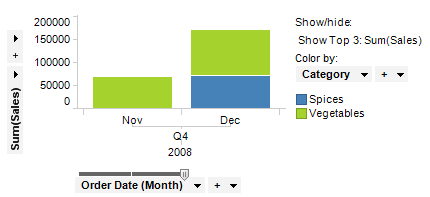
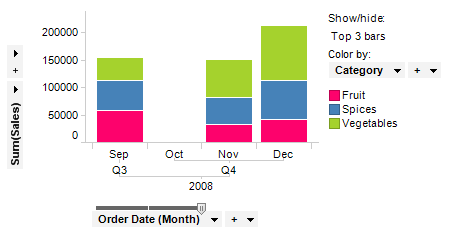
When applying Show/Hide rules, it is always the smallest items in the visualization that you are working with. This means that in a stacked bar chart, it is the bar segments that will be shown or hidden when using a basic rule, and not the entire bars:
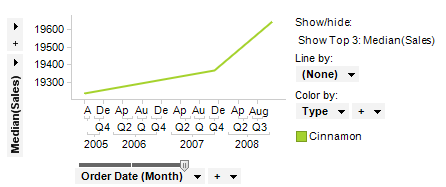
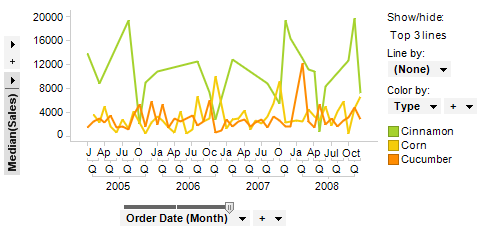
In the same way, in a line chart, it is not the lines themselves but rather the points used to build a line that will be shown or hidden, so a Top 3 rule in a line chart will show you the top three points and not the "top three lines".
You can let your rules take the whole lines or bars into account by using custom expressions, as shown below.
Using OVER Expressions in Rules
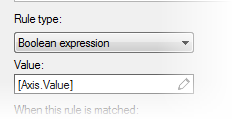
The examples below show a few boolean rules which can be used to apply rules to whole lines or bars. When using these rules, the Value in the rules dialog must be set to [Axis.Value], which will be either true or false.
For example, for a bar chart with Sum(Sales) on the Y-axis, split categorically
by color and with stacked bar segments, the following boolean rule can
be used to show the top three complete bars.
DenseRank(Sum([Sales]) over (All([Axis.Color])),"desc")<=3
Note: For stacked bars where some segments are positive and some are negative, this rule will not act on the positive or negative heights, but rather on the whole Sum for that particular bar.
In a line chart with Median([Sales]) on the Y-axis, grouped using either Line by or Color by, and with a hierarchy on the X-axis (typically a date hierarchy), the following boolean rule can be used to show the top three lines, where "top" means top median value for the whole lines:
DenseRank(Median([Sales]) over (All([Axis.X])),"desc")<=3
Tip: You might also want to consider using Limit Data Using Expression to show or hide specific items instead of using rules.
See also:
How to Work with Show/Hide Items

 Apply individually for each trellis panel