Rules can be very useful when you are setting up color schemes for your visualizations. Rules function as exceptions to the rest of the color scheme. You can use them in all kinds of visualizations, and in any color mode. The collection of available rules is different for categorical columns than for continuous columns. For instance, for categorical color schemes you can add a rule saying that all values starting with a certain letter should have a specific color. For continuous color schemes, you can, among many other things, define a rule stating that all items representing values below a certain value should have a certain color. Or, if you use a date column to color by, you can set up a rule stating that items representing values between two specific dates should get a certain color. See Details on Add/Edit Rule for descriptions of all the rule types.
Example:
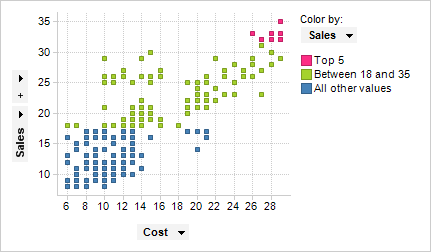
When you add a rule, it is placed at the top of the color scheme in the legend and on the Colors page of the Visualization Properties. It always has higher priority than the rest of the color scheme. If you add more than one rule, the rules will be prioritized from top to bottom. The example below shows a scatter plot that is colored by the column Sales, and the color scheme is set up in Fixed color mode.
The example below shows the color scheme area for the scatter plot above.
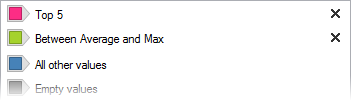
Two rules have been added to the scheme. The first rule states that the items representing the five highest values should get a pink color. The second rule states that all values between average and max should get a green color. The order in which these rules are placed is essential. If the order had been reversed, then the Top 5 rule would not have had any effect since the other rule would include the items representing the five highest values as well. You can change the order of the rules by using drag-and-drop. You can add as many rules as you like to a color scheme, but a rule that does not have any effect on the visualization is not shown in the legend. For example, if you have filtered out all the data that was originally included in the rule, or if another rule overrides it, that rule will no longer be shown in the legend.
To add a rule to a color scheme:
Open the Visualization Properties dialog, and go to the Colors page.
Click on the Add Rule... button to the right of the color scheme area.
Response: The Add Rule dialog is opened.
Select which rule to use from the Rule type drop-down list.
In the Value
field, click on the icon, ![]() , to open
the menu.
, to open
the menu.
Select which kind of value to use in the rule. If you select the menu option Value, you also need to provide a value in the field.
Note: Which options are available in the menu depends on the selected rule type. See Details on Point/Value Menu to learn more.
Open the Color selector and select a color to use for the rule.
Click OK.
Response: The rule is added at the top of the color scheme.
To edit a rule:
Go to the Colors page of the Visualization Properties dialog.
Locate the rule of interest in the color schemes area.
Right-click on the rule, and select Edit Rule....
Response: The Edit Rule dialog is opened.
Note: You can also double-click on the rule to open the dialog.
To delete a rule:
Go to the Colors page of the Visualization Properties dialog.
Locate the rule of interest in the color schemes area.
Right-click on the rule, and select Delete Rule.
Response: The rule is deleted.
Note: You can also click on the x to the right of the rule to delete it.
See also: