The range filter lets you narrow down the data shown to a range of values.
Interacting with the range filter
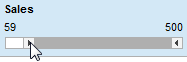
Use the left and right handles on the range filter to change the lower and upper limit of the range. Click and drag a handle to set it to the desired upper or lower limit. Only rows with values within the range will remain visible in the visualizations.
You can also use the keyboard to adjust the range when the filter is active. The left and right arrow keys will move the lower limit, and up and down arrow keys will move the upper limit.
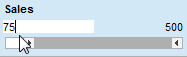
Labels above the slider display the exact current
range. Double-click on a label, enter a value in the field, and press
Enter, if you want to set the range to a specific value:
Click and drag the middle part of the slider to
move the current range sideways.
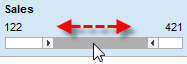
This provides a powerful way of sweeping over different "slices"
of a data table. Observing the reactions of the other filters to such
a sweep can give some interesting clues to correlation between parameters
in the data table.
If the range filter shows dates, you can click
on the calendar icon, ![]() , to set a date for the slider.
, to set a date for the slider.
An important feature of the range filter is that the values are distributed on a linear scale according to the values of the data. Thus, if values are unevenly distributed, this will be reflected in the range filter. Note that this is not the case with item filters, where values are distributed at even intervals along the range of the slider, regardless of the actual numeric values.
If the values of a column are unevenly distributed, you may want to change the scale used on the range slider to get better granularity when moving the slider handles. A column with many low values but only a few high values can benefit from using a Log10 scale. The scale setting does not alter the data in any way, just how the values are distributed along the slider.
Right-click on the range filter to bring up the pop-up menu.
Select Filtering Scheme Properties.
Response: The Filtering Scheme Properties dialog is opened.
Under Filter settings, select Scale: Log10.
Click OK.
Response: See example below.
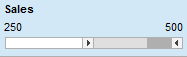
Example: In the example below the range filter represents a column with many low values but only a few high values.
The first image below shows the filter with Original scale – the middle of the slider represents the value 250:
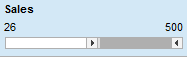
The image below shows the filter when the scale
has been changed to Log10 Scale – the middle of the slider represents
the value 26. It is now easy to set the left handle to specific low
values:
Note: Resetting a range filter by selecting Reset Filter from the right-click menu only affects the range of values in the filter. This means that if the scale has been set to Log10, it will not be changed back to Original.
Narrowing the range filter span to the currently filtered data:
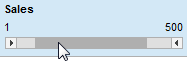
A lighter shade at either
end of the slider indicates that currently there is no data visible
in that part of the range because other filters in the analysis have
filtered out those rows:
Double-click on the center of the range filter.
Response: The range filter is now adjusted, showing
only the effective range:
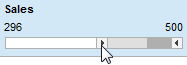
Sometimes you might wish to filter the data in a column using a smaller range than the full range of the column. If so, you can set a range filter to encompass only a smaller range.
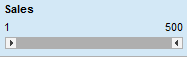
The original range filter
span is 1 to 500.
Move the drag box to narrow
down the selection.
Right-click on the range filter to bring up the pop-up menu.
Select Filtering Scheme Properties.
Response: The Filtering Scheme Properties dialog is opened.
Under Filter settings, select Data range: Specific.
Click on the Range from Filtered button.
Click OK.
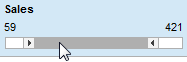
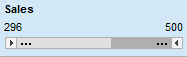
Response: The range filter expands to its full
width, but with the range 296 to 500. Three dots are displayed to
indicate that the range is not the original full range.
Setting the data range without filtering:
You can also set the data range in the Filtering Scheme Properties dialog without filtering out any data beforehand.
Right-click on the range filter to bring up the pop-up menu.
Select Filtering Scheme Properties.
Response: The Filtering Scheme Properties dialog is opened.
Under Filter settings, select Data range: Specific.
Enter Min and Max values in the provided fields.
Click OK.
Response: The range filter is displayed at its full width, but ranging between the values you provided in the Min and Max fields. Three dots are displayed to indicate that the range is not the original full range.
See also: