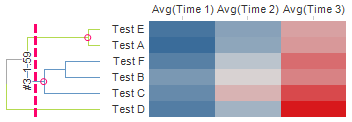
Hierarchical clustering arranges items in a hierarchy with a treelike structure based on the distance or similarity between them. The graphical representation of the resulting hierarchy is a tree-structured graph called a dendrogram. In Spotfire, hierarchical clustering and dendrograms are strongly connected to heat map visualizations. You can cluster both rows and columns in the heat map. Row dendrograms show the distance or similarity between rows, and which nodes each row belongs to as a result of clustering. Column dendrograms show the distance or similarity between the variables (the selected cell value columns). The example below shows a heat map with a row dendrogram.

You can perform hierarchical clustering in two different ways: by using the Hierarchical Clustering tool, or by performing hierarchical clustering on an existing heat map visualization. If you use the Hierarchical clustering tool, a heat map with a dendrogram will be created. To learn more about heat maps and dendrograms, see What is a Heat Map? and Dendrograms and Clustering.
Algorithm
The algorithm used for hierarchical clustering in Spotfire is a hierarchical agglomerative method. For row clustering, the cluster analysis begins with each row placed in a separate cluster. Then the distance between all possible combinations of two rows is calculated using a selected distance measure. The two most similar clusters are then grouped together and form a new cluster. In subsequent steps, the distance between the new cluster and all remaining clusters is recalculated using a selected clustering method. The number of clusters is thereby reduced by one in each iteration step. Eventually, all rows are grouped into one large cluster. The order of the rows in a dendrogram are defined by the selected ordering weight. The cluster analysis works the same way for column clustering.
Note: Only numeric columns will be included when clustering.
See also: