Configuration of Geographical Data for Map Charts
When Shape files are opened in TIBCO Spotfire they are
automatically configured so that they can be used as feature layers in
map charts. However, there may be times when some manual work is needed
before the data can be used in a feature layer.
Requirements and Settings
This bullet list is a summary of what is needed to view
interactive shapes in TIBCO Spotfire. See below for more details on how
you can work with your data to fulfill the requirements.
The binary geometry data needs
to be extracted to one Geometry column and six coordinate columns.
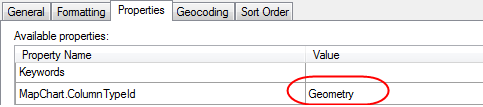
The columns also need to be assigned the proper value on the MapChart.ColumnTypeId column property: Geometry,
XMin, XMax, YMin, YMax, XCenter and YCenter in the Column
Properties dialog:
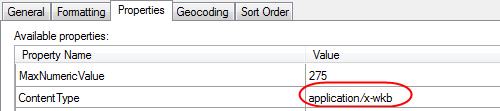
The ContentType
column property needs to be set to application/x-wkb
for the Geometry column in the Column
Properties dialog:
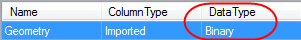
The data type of the geometry
column should be "Binary" or "BLOB" (as seen in
the Column
Properties dialog):
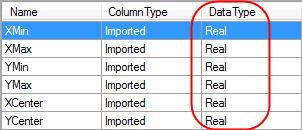
The data types for the coordinate
columns should be "Real" (as seen in the Column
Properties dialog):
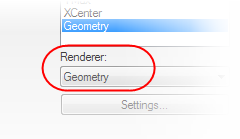
The renderer for the geometry
column should be set to Geometry in the Visualization Properties dialog
of the selected visualization. For example, in the Columns
tab of a Table visualization:
You can also show geometries as shapes in some labels
and tooltips,
and may need to specify the Geometry renderer there.
To set up non-shape
file WKB data:
When the geographical data is located in a Well-Known Binary
(WKB) column, but not originating from a Shape file, you can manually
create the required coordinate columns using the Spatial
functions in the Insert Calculated Column tool.
Click Insert
> Calculated Column....
In the Functions
section, select the Spatial functions
category.
Select the first spatial function,
WKBEnvelopeXCenter and click Insert Function.
Select the WKB column from
the Available columns list and click Insert Columns.
Type a suitable column name
(e.g., XCenter) and click OK.
Response: The XCenter column is created and the
correct property value is set on the MapChart.ColumnTypeId property.
Repeat steps 3 to 5 with the
other five Spatial functions.
Now, create a Map Chart and
use the data table with the newly created columns as the data table
in the Data page of the Feature Layer Settings dialog.
When the geographical data is located in a database and
an information link is used to retrieve the data, you need to perform
the following steps at the creation of the column elements if you want
the end users of the information link to be able to create map charts
without further configuration:
If you only have a binary
WKB column, you can use TIBCO Spotfire to create the necessary coordinate
columns, as described above. Place the resulting coordinate columns
in the server database to make it easier to use the geographical data
later on. The Geometry column should be
of data type BLOB and the coordinate
columns should be of data type Real.
At the creation of the column
elements in Information Designer, go to the Properties
section on the Column Element
tab. For each column element, expand the Properties field, click
Add... and type MapChart.ColumnTypeId
in the Property name field. In the Value field, type Geometry,
XMax, XMin, YMax, YMin, XCenter or YCenter, depending on which column
you are defining.
Save
the column elements.
Rendering Type
If you want to be able to view data in the Geometry column
as images in a Table visualization, the ContentType column property needs
to be set to application/x-wkb.
Click Tools
> Options and go to the Application
page.
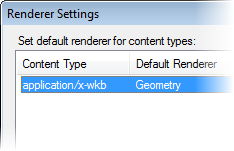
Click on the Renderer
Settings... button.
Response: The Renderer Settings dialog is displayed.
Click Add....
Response: The Add Default Renderer dialog is displayed.
Type application/x-wkb in
the Content type text field.
Select Geometry
as the Default renderer.
Click OK
to close all dialogs.
However, changes of the default settings will not affect
table visualization created before you made the changes. To display the
shapes from the Geometry column in an older table, open
Visualization Properties for the selected table and go to the Columns page to change the renderer for the
Geometry column.
See
also:
Spatial
Functions