Lines can currently be shown in the bar chart, line chart, combination chart, scatter plot and box plot visualizations.
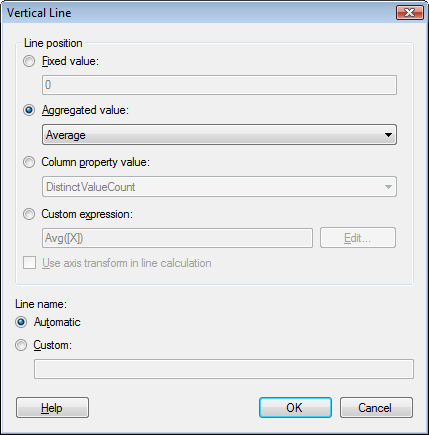
To reach the Horizontal Line or Vertical Line dialog:
In the Visualization Properties dialog of any of the above mentioned visualizations, go to the Lines & Curves page.
Click on Add and select to add either a horizontal or vertical line.
Comment: Selecting a previously added horizontal or vertical line and clicking on Edit... also opens this dialog.

Option |
Description |
Line
position |
Specifies the type of line that you wish to add. |
Fixed
value |
Adds a straight line at the defined value for the selected axis. |
Aggregated
value |
Adds a straight line at the selected aggregation of values for the selected values. |
Column
property value |
Adds a straight line at the specified column property value. All numerical column properties, both predefined and custom properties, are available for selection. |
Custom
expression |
Adds a line at the specified custom expression. |
Edit... |
Opens the Custom Expression dialog, where you can select between columns and functions to define your expression. |
Use
axis transform in line calculation |
Select this check box to apply the same axis transform, i.e., a log scale, to the reference line as has been previously specified on the page for the axis. A reversion of the axis is always applied. |
Line
name |
Specifies whether an Automatic line name should be created, or whether you instead wish to type a Custom line name. |
Note: If you change the orientation of the bars in a bar chart, any added lines will automatically switch orientation as well. For example, if you have added a horizontal line to a vertical bar chart and then switch to horizontal bars, the line will automatically become a vertical line.
See also: