Option |
Description |
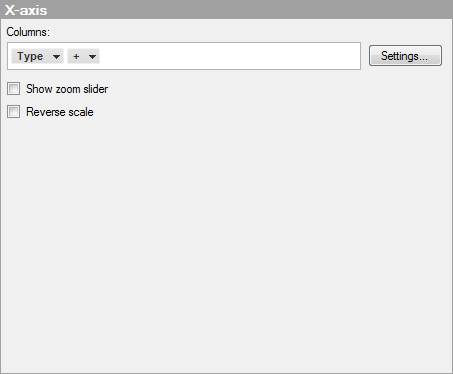
Columns |
Specifies the column or hierarchy to be displayed on the X-axis. |
Settings... |
Opens the Advanced Settings dialog, where you can change the category mode to determine which combinations to show. In a box plot, the X-axis is always categorical. Note: If All values in data (nest) or All possible values (cross) are selected, all boxes, even empty ones, will be shown regardless of filtering. The All possible values (cross) option may result in combinations that are practically impossible and will always remain empty. |
Show zoom slider |
Shows a zoom slider that you can manually manipulate to view only the interesting boxes in the box plot. |
Reverse
scale |
Reverses the current sort order, so that the lowest value is displayed at the top of the scale. |
See also: