Option |
Description |
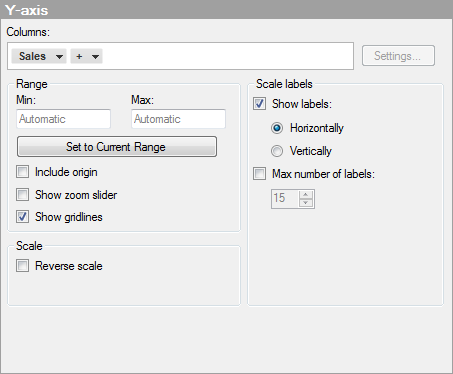
Columns |
Specifies the column or hierarchy to be displayed on the Y-axis. |
Settings... |
[Not available on this axis, since it is always continuous.] |
Range |
|
Min |
Determines the lower value of the axis range. Leave the field blank to automatically adjust the range to the currently lowest value in the filtered data. |
Max |
Determines the upper value of the axis range. Leave the field blank to automatically adjust the range to the currently highest value in the filtered data. |
Set
to Current Range |
Allows you to set the axis range to the currently filtered values.
|
Include
origin |
Available for continuous axes only. Always includes the coordinates (0, 0) in the visualization, regardless of filtering. |
Show
zoom slider |
Shows a zoom slider that you can manually manipulate to view only the interesting segments of the box plot. |
Show gridlines |
Specifies whether or not vertical gridlines should be visible. |
Scale
labels |
|
Show
labels |
Specifies whether or not scale labels should be visible. |
Horizontally |
Shows scale labels horizontally. |
Vertically |
Shows scale labels vertically. |
Max
number of labels |
Select the check box to specify a maximum number of scale labels to be shown. Limiting the number of labels can improve readability on axis scales with many values. |
Scale |
|
Reverse
scale |
Reverses the current sort order, so that the lowest value is displayed at the top of the scale. |
See also: