To reach the Edit Title dialog when specifying a visualization title:
In the Visualization Properties dialog, go to the General page.
Click on the Edit... button to the right of the Title field.
To reach the Edit Title dialog when specifying a page title:
Right-click on a page tab.
Click Rename Page...
Click on the Edit... button to the right of the Title field.
Option |
Description |
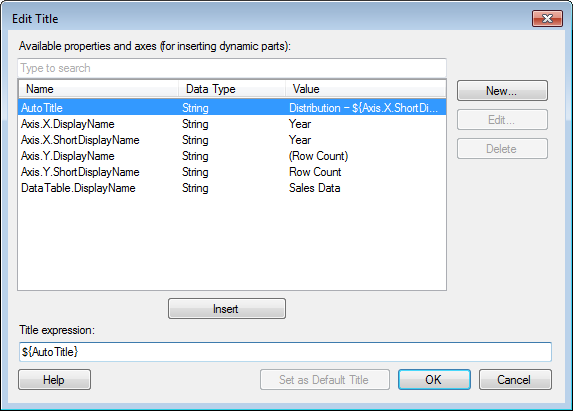
Available
properties and axes (for inserting dynamic parts) |
Lists all the properties and axes that are available for the selected title. The available axis properties depend on the type of title. For instance, some axis properties are not relevant for page titles, and others are not relevant for certain visualization types. See Visualization Properties in Expressions for more information about the available axis properties. Note: If one or more of the visualization properties that should be available for a certain visualization type is missing from the list, it is probably just because you have not defined any value for that axis yet. For example, the Axis.Color.DisplayName option will show up in the list when you have specified something under Color by in the visualization. |
[Type to search] |
Type a search string to limit the number of items in the Available properties and axes list. It is possible to use the wildcard character * in the search. See Searching in TIBCO Spotfire for more information. |
Name |
Lists the names of the available properties. |
Data
Type |
Lists the data types of the properties. |
Value |
Lists the current values of the defined properties. |
New... |
Opens the New Property dialog where you can add new properties to the document. |
Edit... |
Opens the Edit Property dialog where you can edit a selected custom property. Note that predefined properties cannot be edited. |
Delete |
Deletes a selected custom property. Note that predefined properties cannot be deleted. |
Insert |
Adds the selected properties to the Title expression field at the position where the text cursor is located. |
Title
expression |
Displays the title, including any added properties. Example: |
Set
as Default Title |
Click this button to set the current title expression as the default title for all new visualizations of the same type. For example, if you edit the title for a scatter plot and you always want to use that title expression in all new scatter plots, then click on the button. The default titles for all visualization types can also be edited directly in the corresponding page of the Options dialog. |
See also:
Working with Dynamic Titles and Descriptions
Titles and Descriptions Overview