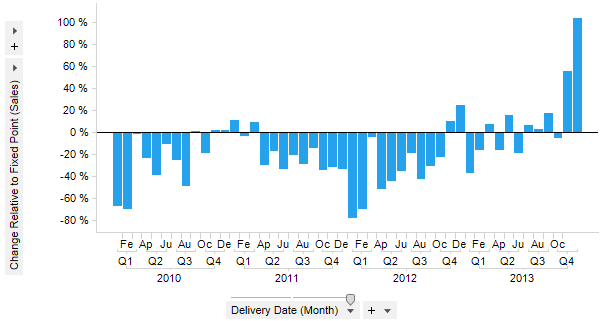
Similar to the Change Relative to Start method, but allows you to specify your own starting point. Used to show the difference in percent between the current node and the specified starting point node. The starting point can be set from a marked node in the visualization.
Example:
Expression:
Sum([Sales]) THEN ([Value] / Sum(If(([X.Year]=2005) AND ([X.Quarter]=3) AND ([X.Month]=9),[Value],0)) OVER (All([Axis.X]))) - 1
The first part of the expression calculates the values to compare. After the THEN keyword comes the calculation to be done on the nodes: the value of each node is divided by the value of the specified fixed point node (here set to September 2005), minus one to show it as a percentage.
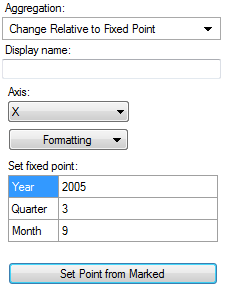
Column Selector Controls in Expanded Mode:
Option |
Description |
Aggregation |
This is where you select the Change Relative to Fixed Point aggregation. |
Display name |
Allows you to specify a different display name, instead of the default "Change Relative to Fixed Point ([Column Name])". |
Axis |
Allows you to specify the axis over which to calculate the nodes. Only categorical axes that perform some kind of grouping can show up in the drop-down list. This means that if you only have a grouping on the X-axis then this is the only axis available, whereas if you also have colored by a categorical column then the Color axis will be available as well, and so on. |
Formatting |
Allows you to change the formatting of the axis. For example, change to Percentage to show the values in percent rather than as decimal numbers. |
Set fixed point |
Allows you to specify the fixed point against which the other nodes should be compare, by typing a Year, Quarter and Month, or whatever you have on the hierarchy axis. |
Set Point from Marked |
Allows you to retrieve the point to compare against by marking a node in the visualization. (If multiple nodes have been marked, then the first node will be used.) |
See also:
Using Expressions on Aggregated Data (the THEN Keyword)