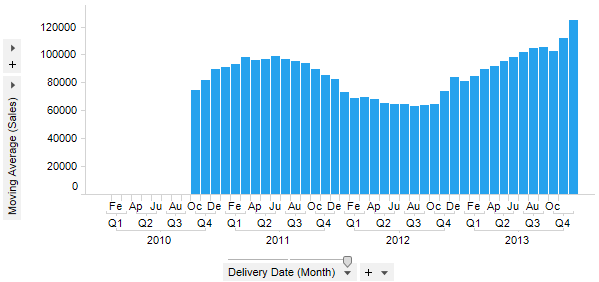
A moving average, also called rolling average, rolling mean or running average, is used to calculate the average of the nodes within a specified interval. If the interval size is set to three then the average is calculated using the current node and the two preceding nodes. The purpose of using a moving average is often to smooth out short-term fluctuations and to spot long-term trends.
Example:
Expression:
Sum([Sales]) THEN Avg([Value]) OVER (LastPeriods(10,[Axis.X])) THEN If(Count() OVER (LastPeriods(10,[Axis.X]))=10,[Value],null)
The first part of the expression calculates the values to compare. After the THEN keyword comes the calculation to be done on the selected nodes: the average of the nodes within the specified interval. In the example above, the interval size is set to 10. The final part of the expression (after the second THEN) will remove all values for nodes which belong to an incomplete interval (because the Exclude incomplete intervals check box is selected, see below).
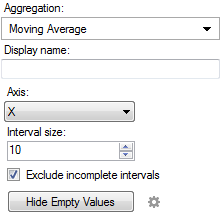
Column Selector Controls in Expanded Mode:
Option |
Description |
Aggregation |
This is where you select the Moving Average aggregation. |
Display name |
Allows you to specify a different display name, instead of the default "Moving Average ([Column Name])". |
Axis |
Allows you to specify the axis over which to calculate the nodes. Only categorical axes that perform some kind of grouping can show up in the drop-down list. This means that if you only have a grouping on the X-axis then this is the only axis available, whereas if you also have colored by a categorical column then the Color axis will be available as well, and so on. |
Interval size |
Defines the size of the window to calculate the average within. |
Exclude incomplete intervals |
Determines whether or not to calculate averages for intervals that lack values for one or more of the nodes in the interval. If the check box is cleared, then the average value will be calculated using those values that are available only. If the check box is selected, nodes within incomplete intervals will be left empty. |
Hide Empty Values |
Creates
a Show/Hide
Items rule that hides all empty values. Click on the properties
symbol, |
See also:
Using Expressions on Aggregated Data (the THEN Keyword)
 , to go to the Show/Hide Items page
of the Visualization Properties dialog to edit or remove the rule.
, to go to the Show/Hide Items page
of the Visualization Properties dialog to edit or remove the rule.