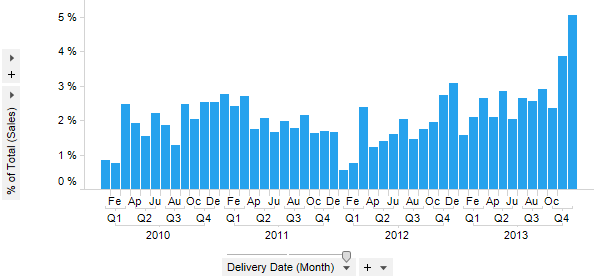
Used to calculate with how many percent each node contributes to the total sum.
Example:
Example:
Sum([Sales]) THEN [Value] / Sum([Value]) OVER (All([Axis.X]))
The first part of the expression calculates the values to compare, i.e., the sum of sales in this example. After the THEN keyword comes the comparison between the nodes: each node gets divided by the sum of all nodes.
Column Selector Controls in Expanded Mode:
Option |
Description |
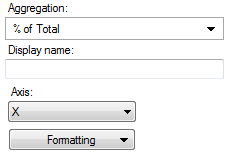
Aggregation |
This is where you select the % of Total aggregation. |
Display name |
Allows you to specify a different display name, instead of the default "% of Total ([Column Name])". |
Axis |
Allows you to specify the axis over which to calculate the nodes. Only categorical axes that perform some kind of grouping can show up in the drop-down list. This means that if you only have a grouping on the X-axis then this is the only axis available, whereas if you also have colored by a categorical column then the Color axis will be available as well, and so on. |
Formatting |
Allows you to change the formatting of the axis. For example, change to Percentage to show the values in percent rather than as decimal numbers. |
See also:
Using Expressions on Aggregated Data (the THEN Keyword)