Line charts are ideal for showing trends over time. A standard example would be how the stock value for a certain company develops over time on the stock market. However, it does not necessarily need to be time along the X-axis. Any data that behaves like a function with respect to the variable on the X-axis can be plotted. Line charts emphasize time flow and rate of change rather than the amount of change.
You can select parts of a line by clicking and dragging with the mouse. If one node in the line is included when you drag, that node will be marked. If two or more adjacent nodes are included, the line between the nodes will also be marked, but if there are nodes in between which are not included, only the separate nodes will be marked. You can select several nodes in different parts of the line by pressing Ctrl and clicking and dragging with the mouse. Press Alt and click and drag to use lasso-marking to encircle the nodes of interest.
Example:
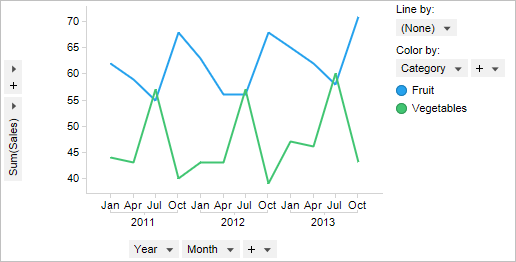
Below is a line chart showing the sum of sales for two different product categories over several years. The line chart has one color (one line) per product category.
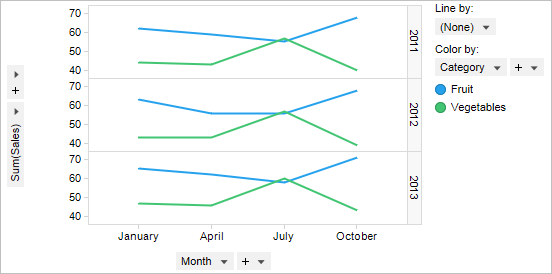
When several different years are available it may also be useful to trellis the data by year to display the variation during the years separately:
Multiple scales can also be used on the Y-axis, when you want to compare several lines with significantly different value ranges.
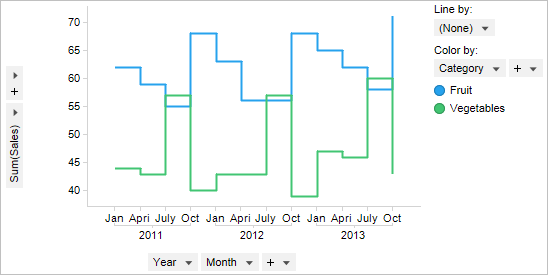
Step lines
The line chart can also be used as a step chart, where the lines are drawn in incremental steps rather than as straight lines between each value.
Step charts are especially useful when changes occur at certain times but the values remain more or less stable between changes.
Changing into step mode is done by selecting the Draw as step lines check box on the Appearance page of the Line Chart Properties dialog.
All visualizations can be set up to show data limited by one or more markings in other visualizations only (details visualizations). Line charts can also be limited by one or more filterings. Another alternative is to set up a line chart without any filtering at all. See Limiting What is Shown in Visualizations for more information.
See also: